Stock Market MAP Waves Part 2, An Alternative to Elliot Waves - Corrections Explained!
Stock-Markets / Stock Markets 2012 May 03, 2012 - 01:58 PM GMTBy: Marc_Horn
 In part 1 http://www.marketoracle.co.uk/... or http://mapportunity.wordpress.com/...I presented the methodology and probabilities for Weekly and Daily pivots. Here I will be looking at establishing the probabilities of smaller scale wave counting and begin to highlight the difficulties in using small scale wave counting. I will also look at where are you most likely to find extensions. You can check the numbers for yourself using simple moving averages to validate my findings, or duff them, in order to make more informed investment decisions. Remember the world was once flat!
As I previously said, I am sure had Ralph Nelson Elliot had the power of computing that I have he would have come to this same conclusion when he developed his theory all those years ago, and at the end you can see MAP Waves work, even on a 1 minute scale!
I will be presenting the same indices, but restricting it from 2011 highs to the recent April 2012 highs using pivots which can be identified on daily bar charts. Whilst looking at the charts also note how the lines, including some from over 10 years ago form resistance and support highlighting the importance of good pivot selection rather than random lines just drawn!
Starting with the S&P.
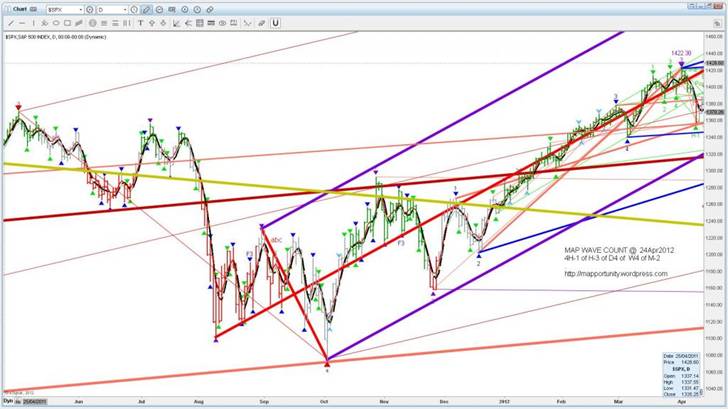
The 5 wave counts are as follows - 4H 8 with 2 failed 3's (abbreviated F3) with trend, H 15 with 1 abc wave 1 (abbreviated W1 W2 W3 W4 W5), 15 minute 3.
Subwaves present as follows: W1 4, W2 1, W3 6, W4 1 and W5 4.
For the Russel.
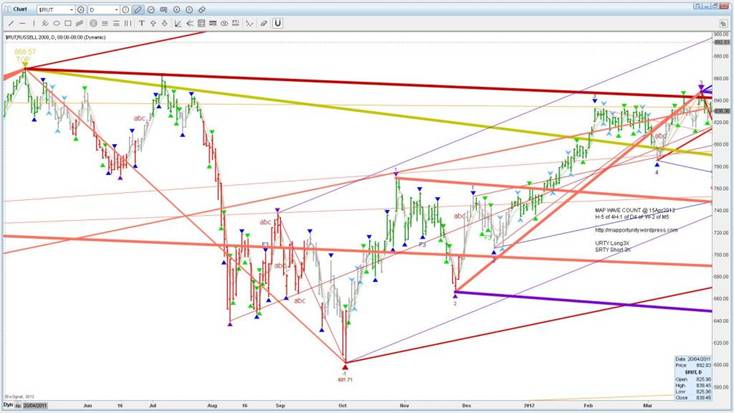
The 5 wave counts are as follows - 4H 8 with 2 F3's with the trend, H 12 with 6 abc's 3 W1's, W2, W3 and W5, 15 minute 6.
Subwaves present as follows: W1 4, W2 1, W3 6, W4 1 and W5 4
For the DJIA.
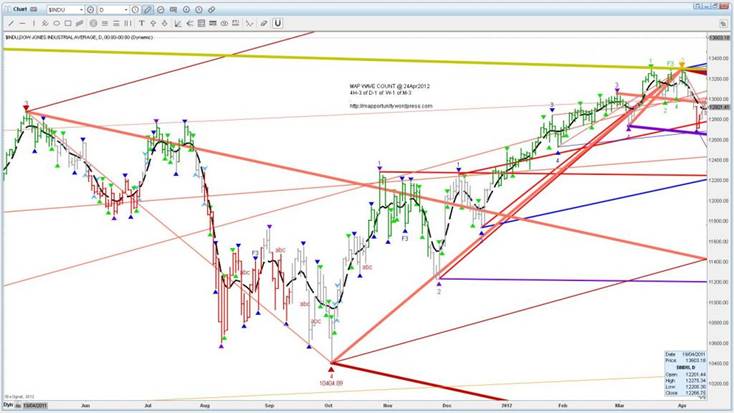
The 5 wave counts are as follows - 4H 8 with 2 F3 with the trend, H 23 with 1 F3 with the trend & 5 abc's W1, W2, two W3 and W4, 15 minute 7 with 1 F3 with the trend.
Subwaves present as follows: W1 5, W2 3 , W3 7, W4 0 and W5 5.
For the Nasdaq.
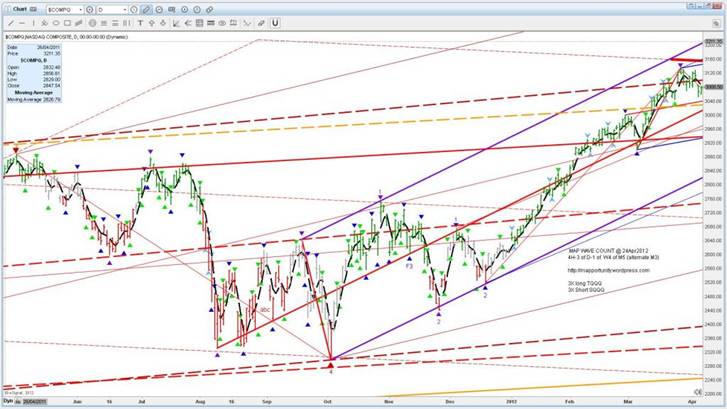
The 5 wave counts are as follows - 4H 8 with 1 F3 with the trend, H 19 with 1 abc W4, 15 minute 4.
Subwaves present as follows: W1 4, W2 5, W3 8, W4 0 and W5 5.
For the DAX
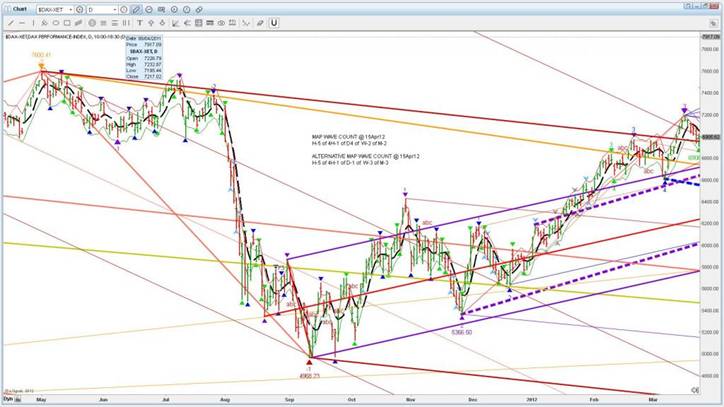
The 5 wave counts are as follows - 4H 8 with 1 F3 and 1 abc W1, H 15 with 4 abc's, W1 W2, W3 and W4, 15 minute 7 with 3 abc, W1, W2 and W5.
Subwaves present as follows: W1 1, W2 2, W3 8, W4 0 and W5 5.
Finally the FTSE. My initial look at the daily scale is interesting and this really needs much more time to sort out as it is possible as suggested in part 1 that as the 14M SMA has rolled over and its wave structure of last years low shows a likely completion of its high which may not be seen again for many years! It has one anomaly prior to its high last year which may mean we now have completed 2 sub waves off the 2000 high, one on the monthly pivot scale, one on the weekly pivot scale and this years high on the 4H would explain the anomaly pointed out in part 1! But that for another day!
So in summary our probabilities for MAP waves following the simple rules of pivot 1 must be >= pivot 0 / pivot 2 <= pivot 1 and >= pivot 0 / pivot 3 >= pivot 1 / pivot 4 >= pivot 2 / pivot 5 >=pivot 3 are as follows;
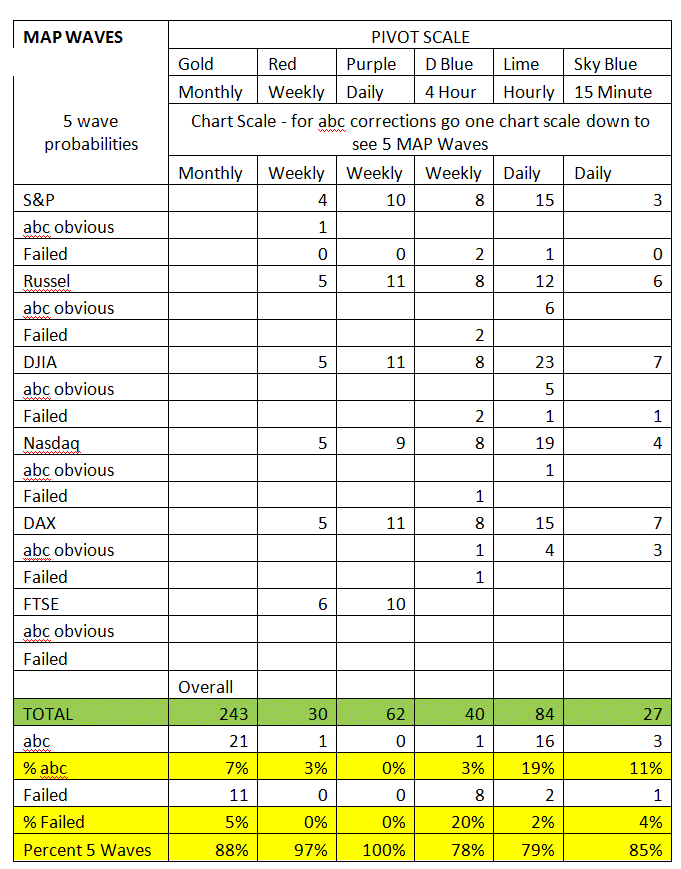
It is clear from the table above that most abc waves form on Hourly waves. The distribution of in which wave they form is W1=6, W2=4, W3=4, W4=3, W5=3, so totally unexpected and contrary to EW where abc corrections should occur in waves 2 and 4 through simple observation - testable by yourself!
Finally below you find the table of where would you expect sub wave formation.
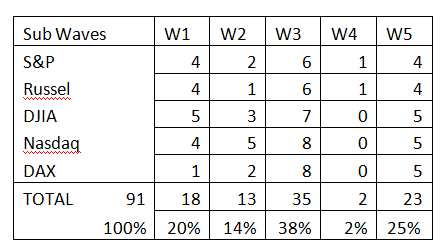
Clearly most sub waves are formed in wave 3, then with an approximate equal number in waves 1 and 5. What is surprising is the ratio of sub waves in waves 2 and 4, with wave 4 being significantly less! This most likely is due to the law of alternation - if one correction is complex the next is likely to be simple, but what this shows is that wave 2 is 10 times more likely to be complex than wave 4, which greatly increases your probabilities of entering the trend at the ideal spot - the start of wave 3!
So in summary if we look at my simple common sense approach of applying moving averages to identify different waves scales the Impulse Wave proposed by Elliot holds very strongly irrespective of the direction the market is moving! However the common sense approach tells me that the correction approach practiced and publicized by EW experts and followers is very misleading to say the least! Despite the small sample sizes even if you double the numbers I have quoted there is still no way that anyone could justify using EW for corrections and use that as a basis of making investment decisions! There are no 2 EW specialists that agree, and some still have corrections where maybe there will be a higher high! So does that mean long or short? Up or Down?
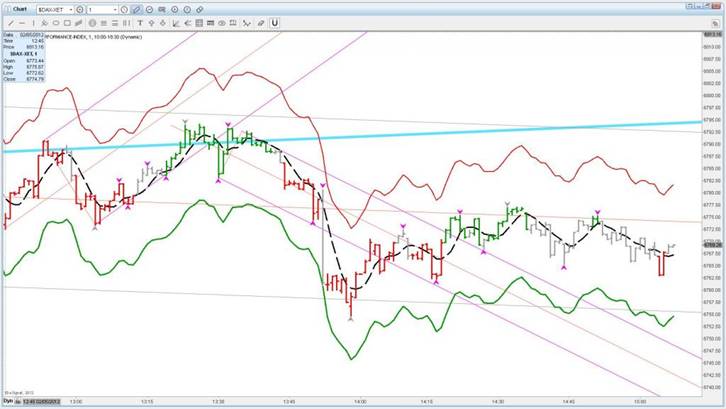
In the next part I will discuss common terminology used by "experts" such as head and shoulders, bull and bear flags, wedges. I am sure most of you can already see them from my explanation of MAP Waves, but this simple pattern recognition will greatly enhance your ability to see potential set ups, ( can you see the head and shoulders, bull and bear flags in the 1 minute chart above?) More importantly using MAP Waves you rapidly can evaluate many experts advice and then decide if you want to stop wasting your money on the huge amount of bad expert advice out there!
For more information of how I do what I do http://mapportunity.wordpress.com/ . Comments and discussions very welcome!
The statements, opinions and analyses presented in this site are provided as educational and general information only. Opinions, estimates, buy and sell signals, and probabilities expressed herein constitute the judgment of the author as of the date indicated and are subject to change without notice.
Nothing contained in this site is intended to be, nor shall it be construed as, investment advice, nor is it to be relied upon in making any investment or other decision.
Prior to making any investment decision, you are advised to consult with your broker, investment advisor or other appropriate tax or financial professional to determine the suitability of any investment.
© 2012 Copyright Marc Horn - All Rights Reserved Disclaimer: The above is a matter of opinion provided for general information purposes only and is not intended as investment advice. Information and analysis above are derived from sources and utilising methods believed to be reliable, but we cannot accept responsibility for any losses you may incur as a result of this analysis. Individuals should consult with their personal financial advisors.
© 2005-2022 http://www.MarketOracle.co.uk - The Market Oracle is a FREE Daily Financial Markets Analysis & Forecasting online publication.


