


Baidu Inc: High Priced or Good Value to Buy?
Companies / Corporate Earnings May 08, 2012 - 04:39 AM GMTBy: Fast_Graphs

 Baidu Inc (BIDU) is most commonly referred to as the Chinese version of Google. Not unlike Google, Baidu Inc has generated an extraordinary record of earnings growth over its short history as a publicly traded company. Furthermore, even though Baidu Inc is trading at one of its lowest price earnings ratio as a public company it has still managed to provide shareholders with lavish returns. Finally, just like Google, the company's future earnings growth rate is expected to slow dramatically against the backdrop of its historical results. On the other hand, future earnings growth is still expected to be among the highest of any company you can find.
Growth stocks are defined as companies with high rates of change of earnings growth of 15% to 20% or better. Growth stocks offer the potential for share prices to rise in lockstep with their profit growth in the long run. Therefore, the PEG ratio formula (price equals growth rate) tends to be the most appropriate formula used to value growth stocks. However, due to the exponential nature of compounding large numbers, PEG ratio forecasts are capped at 40%.
Because of the higher valuation typically awarded to fast growth, growth stocks offer the potential for greater capital appreciation. On the other hand, they also offer higher risk. First of all, they tend to command much higher than average PE ratios, and second, achieving very high levels of growth is very difficult to sustain. Consequently, forecasting future earnings growth is more important with high growth stocks than any other class of stock. Also, the average growth stock typically ploughs all of its profits back into the company to fund its future growth, instead of paying dividends.
Baidu Inc.: Large-cap Growth at an Attractive Price About Baidu Inc: Directly from Google Finance
"Baidu, Inc. (Baidu) is a Chinese-language Internet search provider. Baidu serves three types of online participants, which include users, customers and Baidu union members. The Company offers a Chinese-language search platform on its Website Baidu.com. It provides Chinese-language Internet search services to enable users to find relevant information online, including Web pages, news, images, documents and multimedia files, through links provided on its Websites. It designs and delivers its online marketing services primarily on its Baidu.com Website to its online marketing customers. During the year ended December 31, 2011, it had approximately 488,000 active online marketing customers. Its online marketing customers consist of small and medium enterprises (SMEs) throughout China, large domestic companies and Chinese divisions or subsidiaries of large, multinational companies. On July 20, 2011, the Company acquired 62.01% of the interest of Qunar"
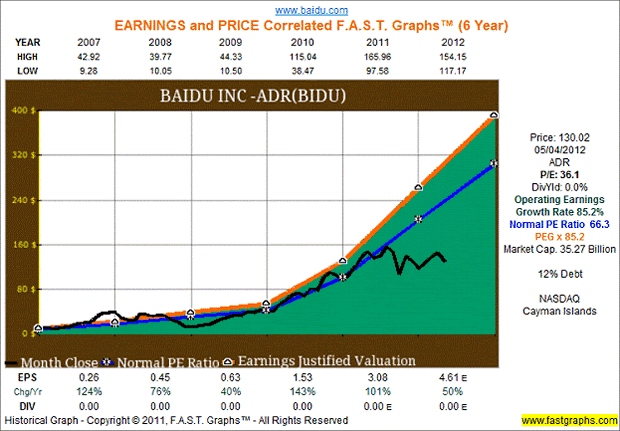
Earnings Determine Market Price: The following earnings and price correlated F.A.S.T. Graphs™ clearly illustrates the importance of earnings. The Earnings Growth Rate Line or True Worth™ Line (orange line with white triangles) is correlated with the historical stock price line. On graph after graph the lines will move in tandem. If the stock price strays away from the earnings line (over or under), inevitably it will come back to earnings. Here is a link to a live and fully functioning graph on Baidu Inc. We suggest running graphs over numerous time frames as part of a more comprehensive fundamental analysis.
Baidu Inc: Historical Earnings, Price, Dividends and Normal PE Since 2007.
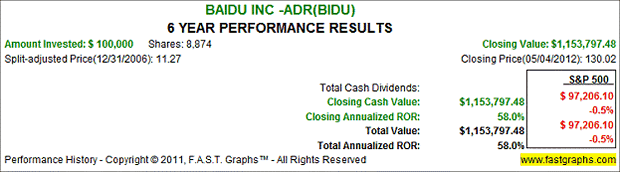
Performance Table Baidu Inc
The Two Keys to Long-Term Performance
Years of research and experience have taught us that there are two critically important keys to achieving above-average, long-term shareholder returns at reasonably controlled levels of risk. The first key is earnings growth, or what we like to call the rate of change of earnings growth. The faster a company can grow its business (i.e. earnings), the larger the income stream it can produce with which to reward shareholders. This is because of the power of compounding, which Albert Einstein was alleged to have called "the most powerful force on earth." Ultimately, both capital appreciation and dividend income will be a function of a company's ability to grow its profits.
The second key is valuation. When a company can be purchased at its intrinsic value based on earnings and cash flow generation, the shareholders' rate of return or long-term capital appreciation will inevitably correlate to and/or equal its earnings growth rate. Overvaluation will lower that rate of return and conversely, undervaluation will increase it. Consequently, paying strict attention to the valuation you pay to buy a stock is a critical component of both greater return and taking lower risk to achieve it. Because, ironically, when you overpay for even the best business, you simultaneously lower your return potential while increasing your risk of achieving the lower return.
The associated performance results with the earnings and price correlated graph, validates the above discussion regarding the two keys to long-term performance. Notice the impact that valuation (black line above or below orange earnings justified valuation line) had on the following performance results.
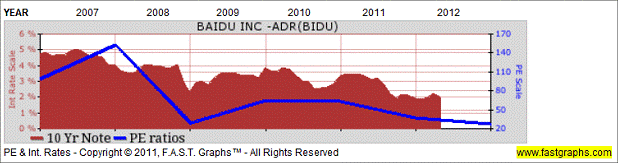
The following graph plots the historically normal PE ratio (the dark blue line) correlated with 10-year Treasury note interest. Notice that the current price earnings ratio on this quality company is as low as it has been since 2007.
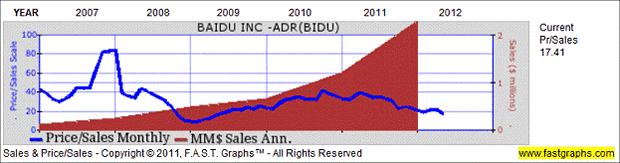
A further indication of valuation can be seen by examining a company's current price to sales ratio relative to its historical price to sales ratio. The current price to sales ratio for Baidu Inc is 17.41 which is historically low.
Looking to the Future
Extensive research has provided a preponderance of conclusive evidence that future long-term returns are a function of two critical determinants:
- The rate of change (growth rate) of the company's earnings
- The price or valuation you pay to buy those earnings
Forecasting future earnings growth, bought at sound valuations, is the key to safe, sound, and profitable performance.
Therefore, it logically follows that measuring performance without simultaneously measuring valuation is a job half done. Baidu Inc is clearly an industry leading superior business, which based on the consensus estimates from leading analysts, appears to be capable of growing earnings at an above-average rate for the foreseeable future. At its current price, which is attractively aligned with its True Worth™ valuation, Baidu Inc represents an opportunity for growth at a reasonable price. The important factor is that Baidu Inc, with its strong balance sheet and potential for future earnings growth, has real assets and cash flow underpinning its stock price. This solid economic foundation offers shareholders the potential for both a strong margin of safety and an opportunity for outsized future returns.
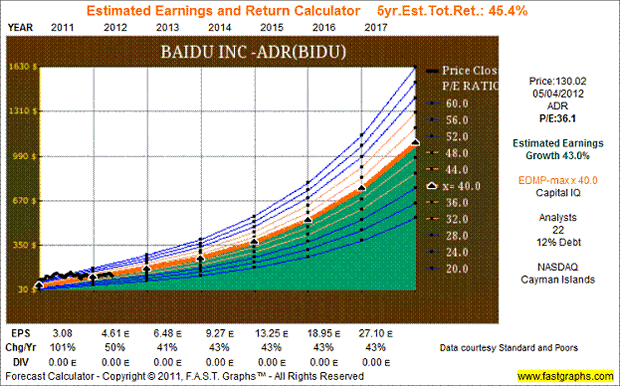
The Estimated Earnings and Return Calculator Tool is a simple yet powerful resource that empowers the user to calculate and run various investing scenarios that generate precise rate of return potentialities. Thinking the investment through to its logical conclusion is an important component towards making sound and prudent commonsense investing decisions.
The consensus of 22 leading analysts reporting to Capital IQ forecast Baidu Inc's long-term earnings growth at 43%. Baidu Inc has low long-term debt at 12% of capital. Baidu Inc is currently trading at a P/E of 36.1, which is inside the value corridor (defined by the five orange lines) of a maximum P/E of 48. If the earnings materialize as forecast, Baidu Inc's True Worth™ valuation would be $1083.87 at the end of 2017, which would be a 45.4% annual rate of return from the current price.
Earnings Yield Estimates
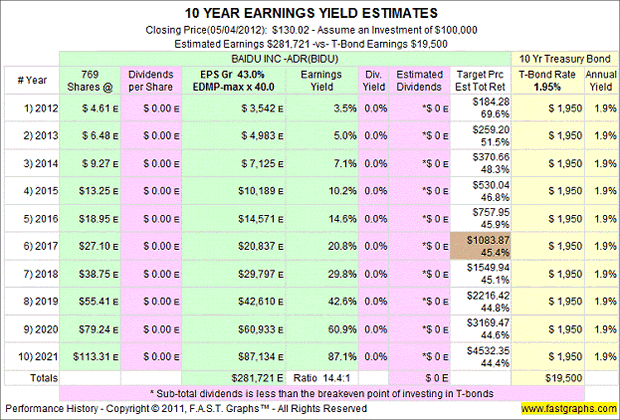
Discounted Future Cash Flows: All companies derive their value from the future cash flows (earnings) they are capable of generating for their stake holders over time. Therefore, because Earnings Determine Market Price in the long run, we expect the future earnings of a company to justify the price we pay.
Since all investments potentially compete with all other investments, it is useful to compare investing in any perspective company to that of a comparable investment in low risk Treasury bonds. Comparing an investment in Baidu Inc to an equal investment in 10 year Treasury bonds, illustrates that Baidu Inc's expected earnings would be 14.4 times that of the 10 Year T-Bond Interest. (See EYE chart below). This is the essence of the importance of proper valuation as a critical investing component.
Summary & Conclusions
This report presented essential "fundamentals at a glance" illustrating the past and present valuation based on earnings achievements as reported. Future forecasts for earnings growth are based on the consensus of leading analysts. Although, with just a quick glance you can know a lot about the company, it's imperative that the reader conducts their own due diligence in order to validate whether the consensus estimates seem reasonable or not.
Baidu Inc is expected to grow earnings over the next five years at over 40% per annum and can currently be purchased at a PE ratio that is lower than its forecast growth rate. Therefore, the case could be made that the company is currently cheap on that basis. On the other hand, its current PE ratio of over 36 would be considered very high relative to the average company. Consequently, this fast-growing internationally based large-cap represents a dilemma for the aggressive investor seeking maximum capital appreciation.
On the one hand, the stock is cheap relative to expected growth. While on the other hand, its current valuation is more than twice the average company. Therefore, we believe that although the company appears attractively valued based on earnings growth, it should be recognized that it is only appropriate for the aggressive investor seeking maximum capital appreciation. Furthermore, there are additional risks that the discerning investor should consider before investing in Baidu Inc.
Disclosure: No positions at the time of writing.
By Fast Graphs
Disclaimer: The opinions in this document are for informational and educational purposes only and should not be construed as a recommendation to buy or sell the stocks mentioned or to solicit transactions or clients. Past performance of the companies discussed may not continue and the companies may not achieve the earnings growth as predicted. The information in this document is believed to be accurate, but under no circumstances should a person act upon the information contained within. We do not recommend that anyone act upon any investment information without first consulting an investment advisor as to the suitability of such investments for his specific situation.
© 2005-2022 http://www.MarketOracle.co.uk - The Market Oracle is a FREE Daily Financial Markets Analysis & Forecasting online publication.