


Global Stock Markets Turmoil on the Way?
Stock-Markets / Global Stock Markets May 14, 2012 - 04:59 AM GMTBy: Sam_Chee_Kong

 Stock Markets around the world have been on a roller coaster ride for the past couple of weeks. Poor market sentiments does not augur well for the markets either. From the oil embargo in the Middle East to the debt crisis woes in Europe added more volatility to the already fragile markets.
VIX or Fear Indicator
To get an insight into investor’s barometer or perception towards the market, the best indicator to look at will be the VIX or better known as the ‘fear index’. VIX or the Volatility Index Indicator measures the investor’s sentiment towards the market .A VIX reading of less than 30 means investors are feeling positive and complacent. And if it moves towards 50 and beyond means investors are nervous and indecisive and hence the markets are unstable. The higher the reading the more unstable the markets and in fact the historic high is during the height of the 2008 financial crisis which is about 89 points. The following is the VIX chart as of 12/05/2012.
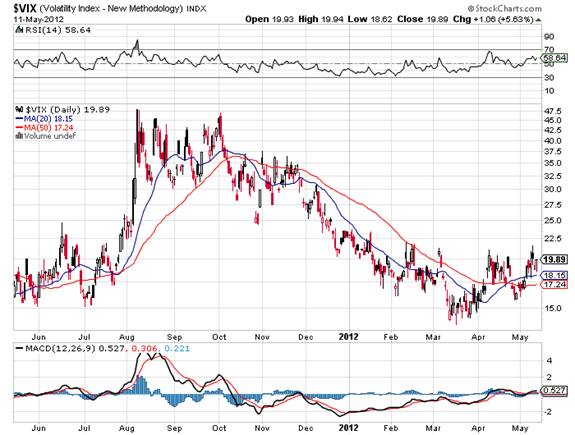
What we can conclude from the above chart is that the VIX indicator had rebounded from its low in 16/03/2012 which is 12.66 points. It is now sitting nicely above both the MA20 and MA50. The last time the price is above both Moving Averages is during the beginning of October 2011.
Take a look at the chart during the October 2011 takedown in Stock Markets worldwide. At that time the VIX is trading at about 47.5 points. Since then investors sentiment had been improving until mid march this year.
As you can see there is a base building or consolidation from March till May this year and it already started moving out from its recent resistance at the 20 points level. This will signifies more negative sentiments among investors in the coming weeks. When it approaches the 30 points threshold, we will expect more volatility in global stock markets.
Global Stock Markets in a Nutshell
Now let’s take a look at the performance of different markets in a technical perspective, around the globe starting with the Dow Jones.
America - Dow Jones
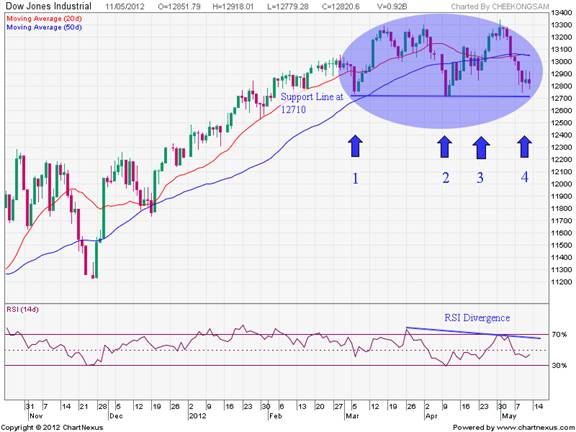
We have yet to change our outlook on the Dow since our last analysis on 06/0502012. As the Dow is still hovering above the 12710 support line, there is still a chance for it to recover above the 13000 points level. But this time, our view is more bearish bias at the moment because bad news from abroad especially from Europe still weighed down on the Dow. Even with better than expected unemployment data, it failed to lift the market sentiment. Other factors that strengthen our negative bias towards the Dow are as follows.
- The MA20 days close below the MA50 days for the first time since October 2011.
- Secondly, notice the labels, which had been marked as 1,2,and 3. Those are the periods where the Dow closed below 13,000 points but anyhow it managed to rebound back above the 13,000 points level. Label 4 is the most recent close of the Dow, which is at 12,820 points. We will have to wait for confirmation of the trend in the next few session.
- Notice the Divergence in the RSI since the mid of March 2011 which somehow coincide with the rise in the reading of the VIX indicator. It seems like the bears will have an upper hand against the bulls at this moment.
Anyhow, what we perceive is that the Dow needs to hold on to the support at 12710. Breaking through the support will mean that the Dow will be testing the next support level at 11800 points.
Europe – German DAX
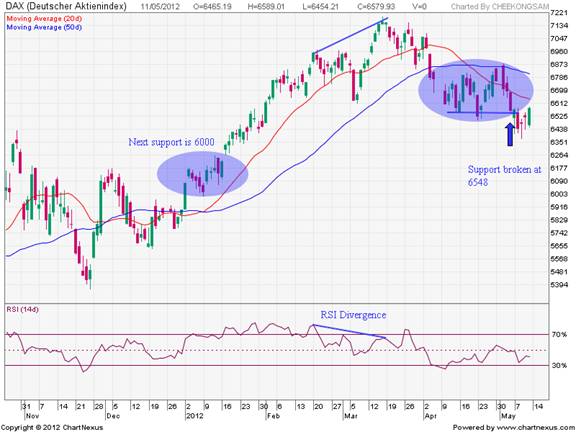
European Markets are more at risk for further declines because technically most of the European markets are bearish biased because their MA20 are already below MA50. Most are looking towards breaking recent lows. Let’s take a look at DAX.
It has already broke away from the pack, where the support level 6548 holds. The next support level for the DAX will be at 6000 points. Most European markets are bearish from the technical point of view. We will expect more volatility in the European Markets with a bearish bias.
ASIA – Japan
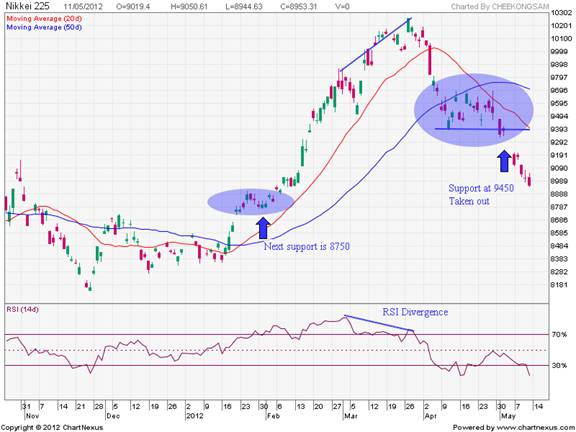
We foresee profound weakness in the Japanese Nikkei 225. The Nikkei had been down for the last 10 days dropping a total of more than 750 points after breaking the support level at 9400. Although most indicators like RSI, MACD and Stochastic are in the oversold region, we don’t see any indication of a strong rebound any time soon. In fact we expect the Nikkei to further ease next week and test the next support level at 8750.
ASIA – Kuala Lumpur KLCI
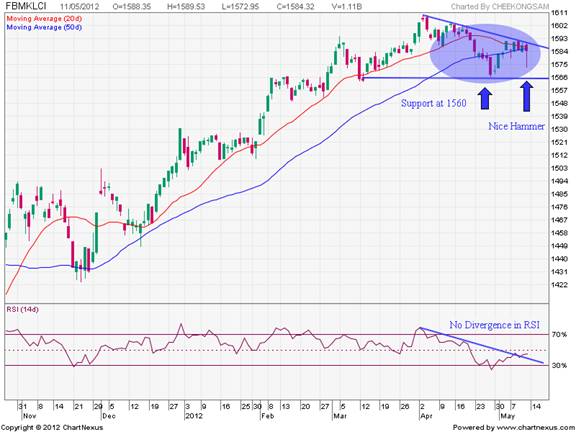
Our outlook for KLCI remains the same as our prediction space last week. The absence of any divergence in the technical indicators augurs well for the KLCI. KLCI will be able to withstand this downturn better than most markets and in fact as of 11/05/2012, it close with a long leg hammer which represent strength As long as it doesn’t violate the 1560 support and also the MA20 don’t go below MA50, the uptrend in KLCI remains intact.
ASIA – Bombay Sensex 30

In line with our earlier prediction on 06/05/2012, Bombay Sensex 30 did in fact free fall since it broke off from the pack at 17050 to close at 16292. A total of about 800 points got wipe out. We will be seeing further deteriation in the Sensex with a chance for rebound towards the end of the week. It will be testing its next support at 15150 in the coming weeks.
ASIA – Jakarta’s IHSG
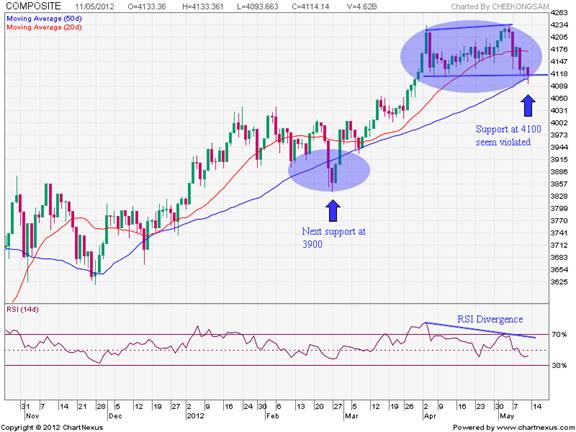
Again we are seeing the same old picture of Jakarta Stock Exchange except the overall technical has deteriorated. RSI has shown a divergence since end of March. Now Jakarta’s IHSG is at a critical juncture as it is now sitting on the support level. Any violation below this level will mean that the IHSG is going to have a big takedown which might bring it down to the next support level at 3900.
A look at most indicators revealed that there are not in the oversold region meaning more room to go down.
South America – Bovespa
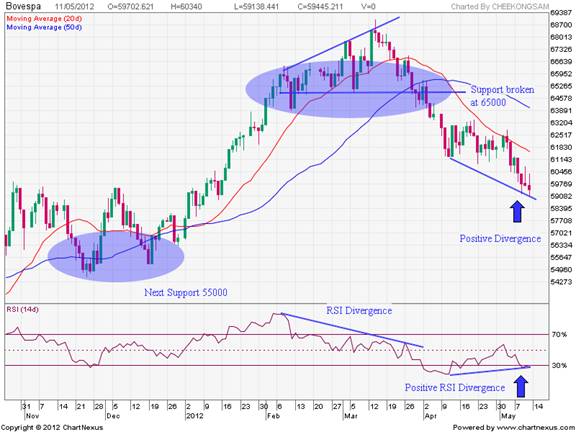
The Brazilian Bovespa seems like it is already reaching an inter-mediate low. Positive divergence seen after the market took a dive from its support at 65000 towards the 59000 level which represents a loss of 6000 points. A market turn around is on the way for Bovespa next week as indicated by a Doji in its last day of trading last week.
However over the longer time Bovespa, still looks weak and more room to fall ahead as the gap between the MA20 and MA50 days are still wide.
Australia – ASX All Ordinaries
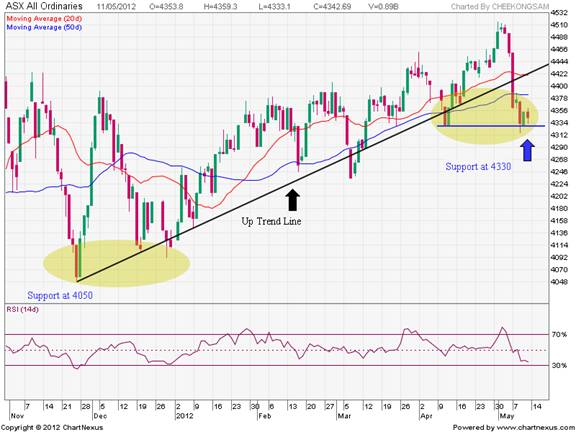
The ASX seems to have broken both the trend line and the MA20 and MA50 days on 08/05/2012. Technically, it seems bearish and the current support level is at 4330. Since most indicators not in the oversold region yet, we opine that the ASX will continue its weakness next week.
by Sam Chee Kong
cheekongsam@yahoo.com
© 2012 Copyright Sam Chee Kong - All Rights Reserved
Disclaimer: The above is a matter of opinion provided for general information purposes only and is not intended as investment advice. Information and analysis above are derived from sources and utilising methods believed to be reliable, but we cannot accept responsibility for any losses you may incur as a result of this analysis. Individuals should consult with their personal financial advisors.
© 2005-2022 http://www.MarketOracle.co.uk - The Market Oracle is a FREE Daily Financial Markets Analysis & Forecasting online publication.