High Risk of Near Term Global Financial, Stock Market Crash
Stock-Markets / Financial Crash May 15, 2012 - 02:36 AM GMTBy: Steven_Vincent

 At each juncture, I look at the available information as represented in the market price and technical data. I approach the body of evidence without preconception and with an open "beginner's mind". I see what I see. I analyze. I develop a set of probabilistic outcomes and then rank them. Then I write my report. I simply report my findings.
There is an extraordinarily high risk of some variety of global market panic in the relatively near term. In fact, I would say that there is a extant setup that is as perfectly aligned for an extreme market event as could be dreamed of by the most bearish of permabears. I'm no permabear, but a thorough review of the current price and technical charts has revealed an inordinate confluence of data points which collaborate to represent a very high risk profile. The current extreme risk profile is amplified by a nearly total lack of recognition on the part of market participants. A deflationary episode, potentially on the scale of the 2008 event, is presently on the table. Investors would do well to at least consider the facts, analysis and conclusions of this report.
BULLISH CONSENSUS
I generally place Sentiment and Psychology at the bottom layers of my analysis since it it the softest and least reliable data to consider, but in this case I am going to lead with it simply because there appears to be not merely a significant gap between perception and reality but apparently a widening chasm. Bulls are repeatedly citing "excessive" or "extreme" Bearishness as a primary basis for an ongoing Bullish outlook, but the evidence strongly suggests this is not only not warranted but that the exact opposite conditions prevail.
There appears to be nearly total complacency in the present market environment. Few if any analysts are currently willing to consider a market top of any kind, much less a crash. Based on the findings in my current BullBear Market Report, the continued bold bullishness of the overwhelming majority is simply not supported by the technicals of the market.
Of late many Bulls are citing American Association of Individual Investors poll data which they view as proof positive of extreme bearishness in the market. First, let it be said that this data is soft and its interpretation is highly subjective and as such it is rarely useful and its best use comes when one side of the market is leaning heavily on its perception of the data to justify its market position.
Let's have a look at the current AAII data. Theoretically, a reading of 25% bulls and 43% bears tells us that most individual investors are bearishly aligned and therefore out of the market or short, setting up a bullish resolution. Let's backtest that a little:
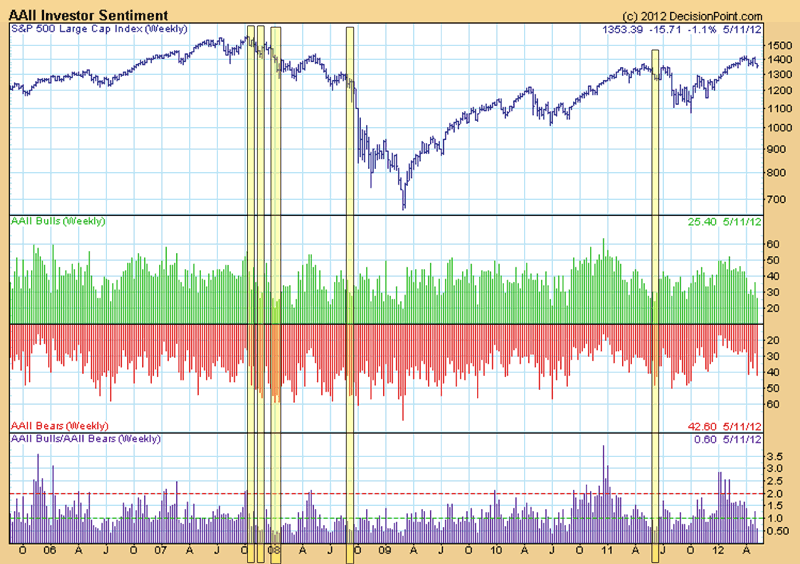
In late May of 2011 there was a reading that exceeded the current poll. While it did mark a short term bottom and a sharp rally ensued (and the current setup could be similar), it was very brief and was immediately followed by a market crash. At the 2007 top, there were multiple readings which exceeded the current poll and yet that turned out to be a spectacularly good time to be Bearish. In 2008, just before the main leg of the crash, there were readings which exceeded the current poll and yet that was certainly a time when the smart money was Bearish. It only took a glance at the actual data to discover that drawing a long term Bullish conclusion from a single week's AAII polling data is entirely unsupported by the facts.
One might also want to look and see if there is some supporting, corroborative data. I did, and there isn't any. In fact, the exact opposite appears to be true. Other similar sentiment data appears to suggest excessive Bullishness in the market at this juncture.
Investor's Intelligence Bull/Bear ratio remains relatively high with a slight increase in Bulls and a sharp drop in Bears to very low levels:

In addition, the percent of II respondents calling for a Correction has surged to a 12 year high as the percent who are Bearish has dropped to levels seen at the 2007, 2010 and 2011 tops:

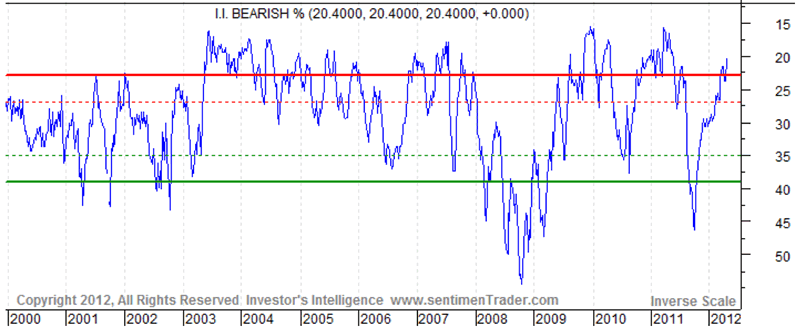
In this context those calling for a Correction are in fact long term Bulls who are looking to buy this dip. For the contrarian, this can be interpreted as a strongly Bearish setup.
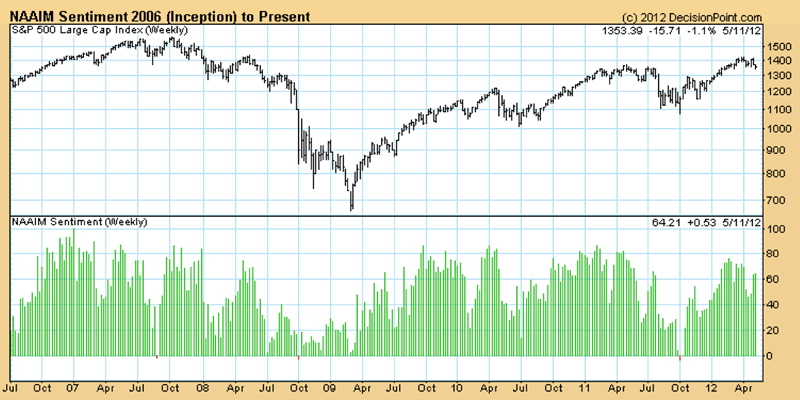
National Association of Active Investment Managers poll surged to over 60% bulls last week and increased yet again this week:
Consensus Inc survey is certainly in the sell zone:

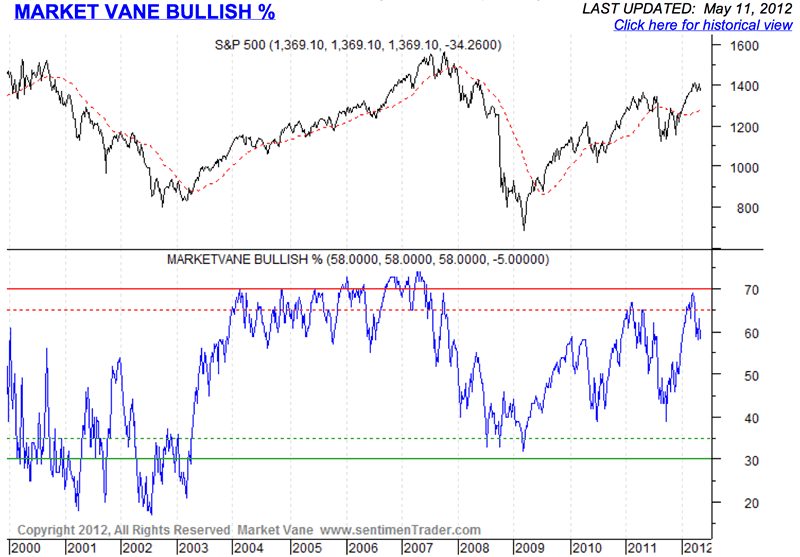
Market Vane is at levels far more correlated with significant tops than bottoms:
Hulbert Stock Sentiment is closer to its Bull extreme than its Bearish extreme:
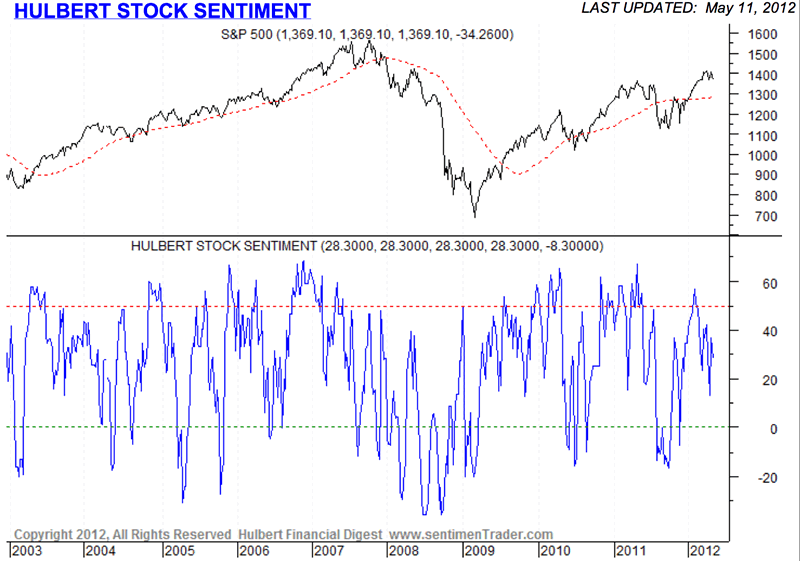
Now let me be clear. I am not basing my Bearish market view on this sentiment data. I am merely pointing out that, contrary to current popular perception, sentiment polling data supports a Bearish rather than a Bullish view.
A survey of the financial news media and popular blog sites also reveals very little in the way of bearish psychology. Few if any are calling a top of significance while some grudgingly admit the possibility of a "pullback" or "correction".
BEARISH ASSET ALLOCATION, LOW CASH
A little more digging into the AAII data shows that the same investors who are supposedly "extremely bearish" have allocated assets in a pattern that closely resembles that which has been found at important tops:
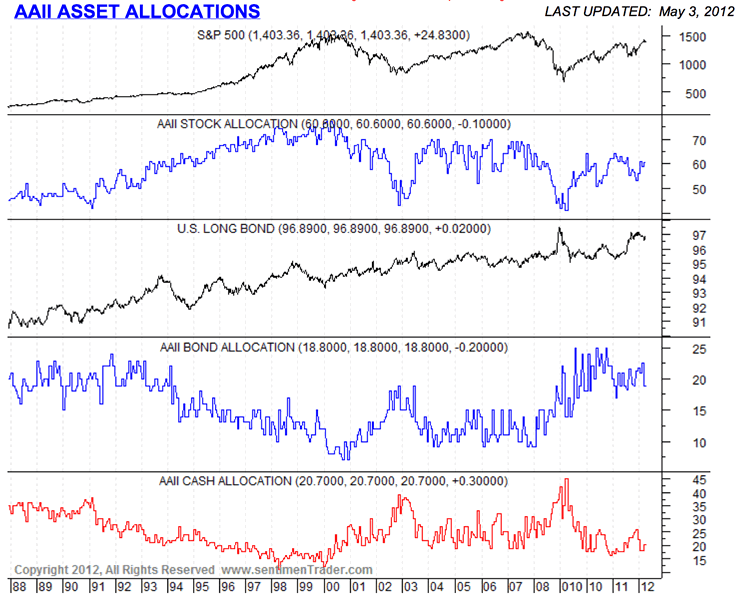
Stock allocation is at the same levels found immediately preceding the 2008, 2010 and 2011 crashes and only slightly below levels found immediately preceding the 2001 and 2002 crashes. Investors were similarly allocated to bonds just prior to the 2010 and 2011 declines. Cash allocation is identical to that found at the 2007, 2010 and 2011 tops and only slightly higher than that found at the 2000 top.
Rydex fund asset distribution data corroborates the AAII data:
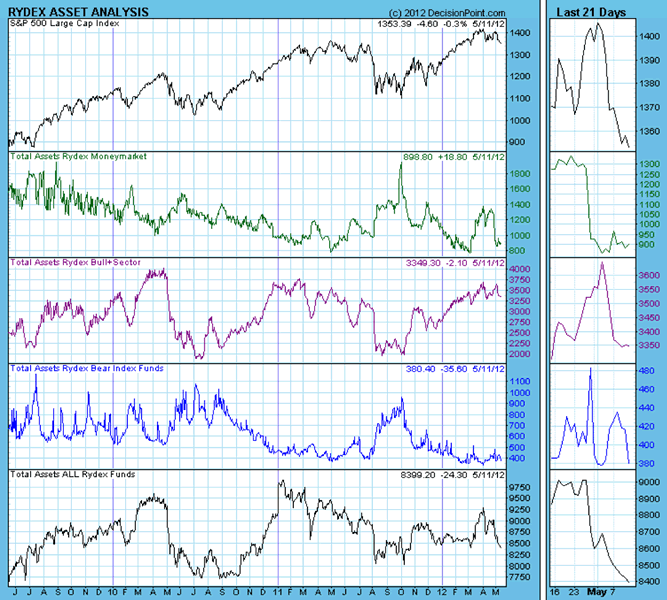
Available cash in Money Market funds is nearly at a 3 year low. Rydex Bull fund allocation is hovering near the highs while Bear fund allocation is at the lows. Total assets in all Rydex funds is falling as money exits the markets.
Rydex asset ratio also corroborates the AAII data. It has surged to the bullish side recently to levels above the 2011 highs and is at levels far above those found at the 2007 and 2010 tops:
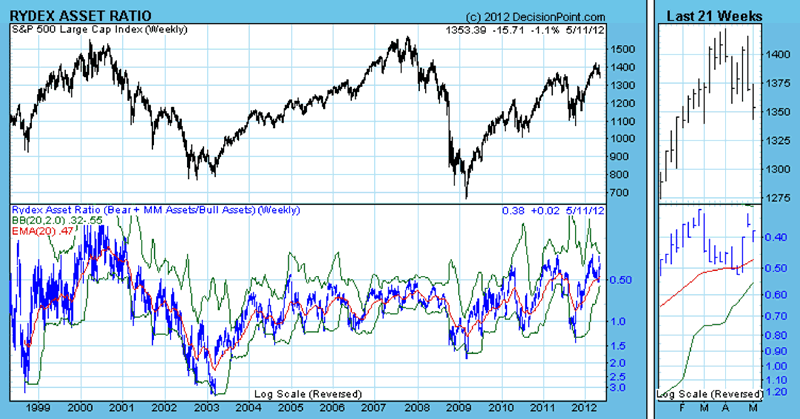
It appears that market participants have clearly chosen to view the recent decline as a buying opportunity and show no sign of fearing a significant bearish turn in the markets. This smacks of late bulls desperately seeking an entry point at the top of the market, trying to make up for having missed the big run. In light of the technical analysis I present in the current BullBear Market Report, this behavior may represent a dangerous misalignment with reality.
Much ado is currently being made of equity Mutual Fund outflows and Bond fund inflows. In my view the evaporation of public interest in stocks in the current environment is not bullish. Bulls argue that this means that the public is not invested and therefore represents latent buying power on the sidelines. While this may be true in the context of a healthy bull market, we will see later in this report that this market is not technically sound. In this context the flight of public capital from the markets represents a dearth of available cash, not a surplus:
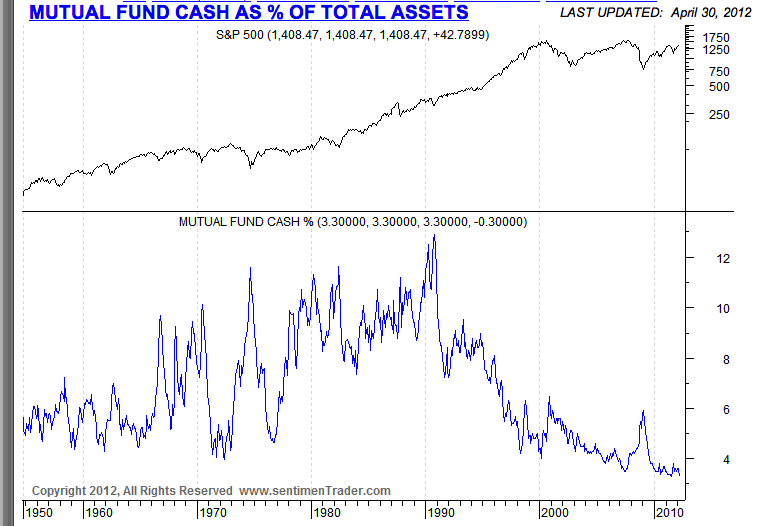
Mutual Fund cash is at all time lows.
The available cash sitting on the sidelines in money market funds ready to be deployed is near record lows:
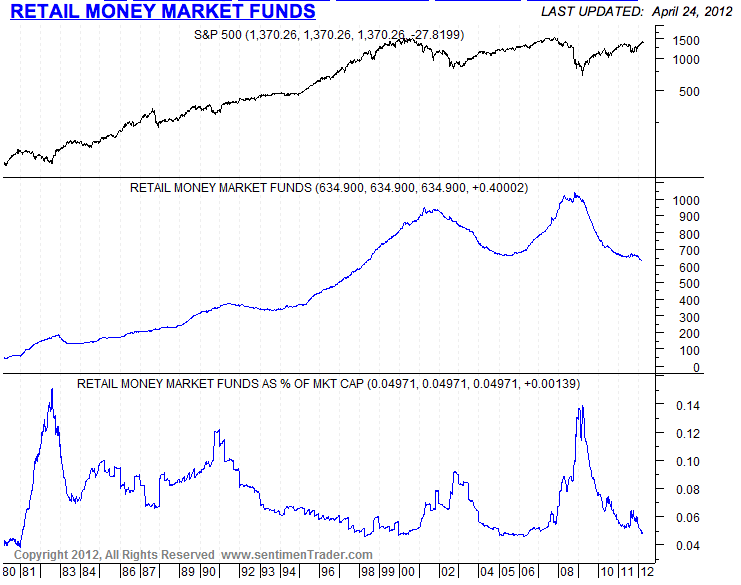
In the context of a bullish consensus coupled with a technically weak market, this is a very dangerous situation. Any unexpected market dislocation could result is a free fall with little in the way of sideline cash to stop the fall.
The 200 EMA of Total Market Volume peaked on the first decline of the 2007 bear market:
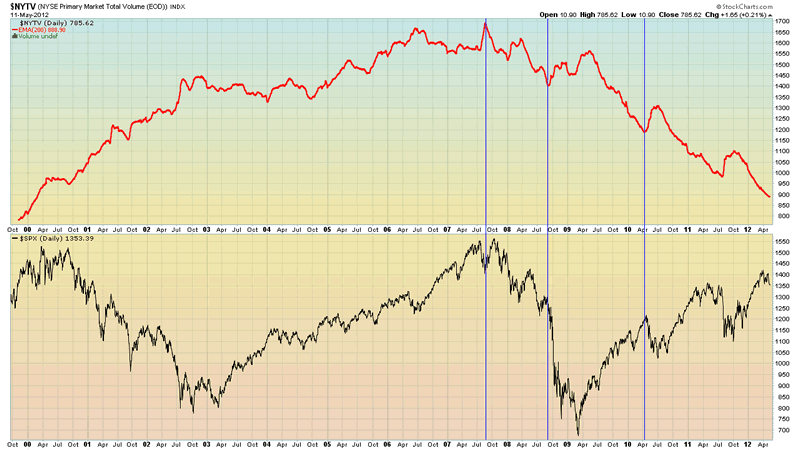
It has been declining steadily since then. Declining volume during the 2007-2009 bear market was not Bullish.
Even downside volume slipped during the 2007-2009 decline:
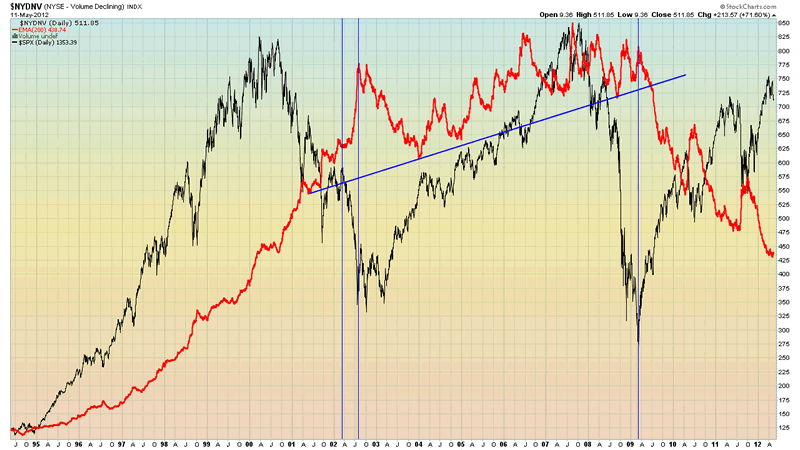
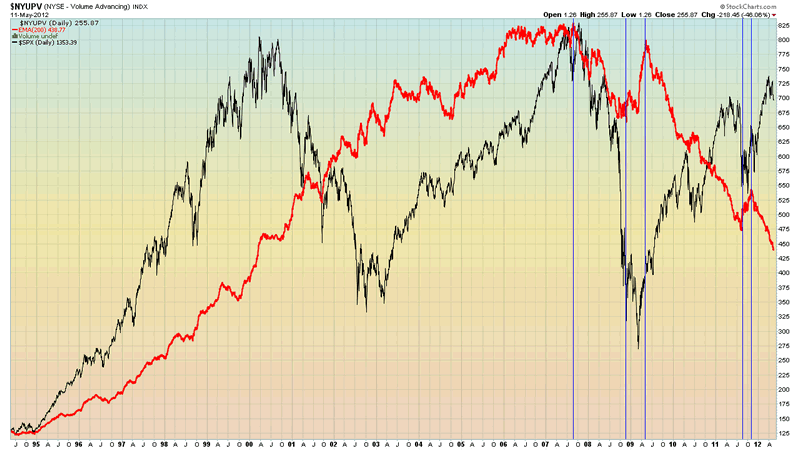
Upside volume is now at levels seen in 1997:
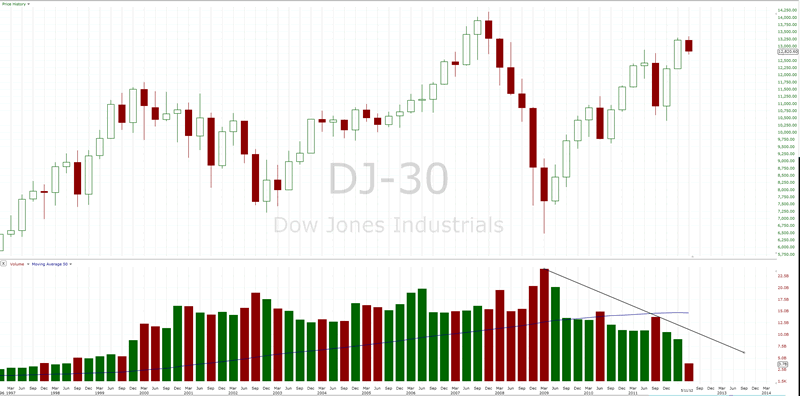
How does the behavior of market volume during the current Bear market compare and contrast with prior bear markets?
As we can see, volume on the Dow has fallen off a cliff since 2007 and since 2009 volume has come in well below the 50 Quarter EMA. Volume declined in every quarter sequentially except in the down quarters during major market pullbacks in 2010 and 2011.
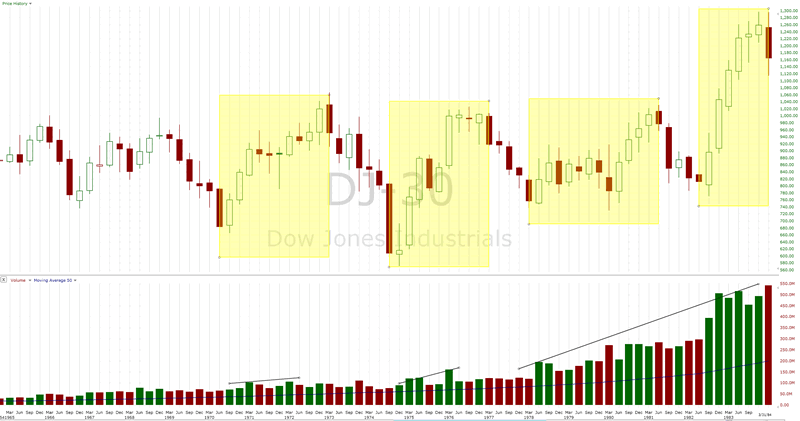
During the 1966-1982 bear market, volume stayed well above the 50 Quarter EMA and even managed to expand during the course of the Bear, with periods of higher volume during Bullish phases and lower volume during Bearish phases, the opposite of what we have seen during our current market. As the Bear neared its end and began to enter a new Bull, market volume began to expand dramatically, doubling as the Bull began its run. That's the opposite of the behavior we have seen in the present market. It's well known that the public fled the markets during this period, much as they have during the current phase, and famously the "Death of Equities" was declared. A dramatic drop in public participation was bearish then, until the bear market ended on expanding volume.
During the 1929-1932 Bear market, volume fell dramatically during the Bear as investors fled the market. During the early stages of the new Bull, volume in excess of the 50 Quarter EMA came almost exclusively during big rallies and Bullish phases with very low volume during Bearish phases. Again, this is quite distinct from the behavior we are seeing in the present market.
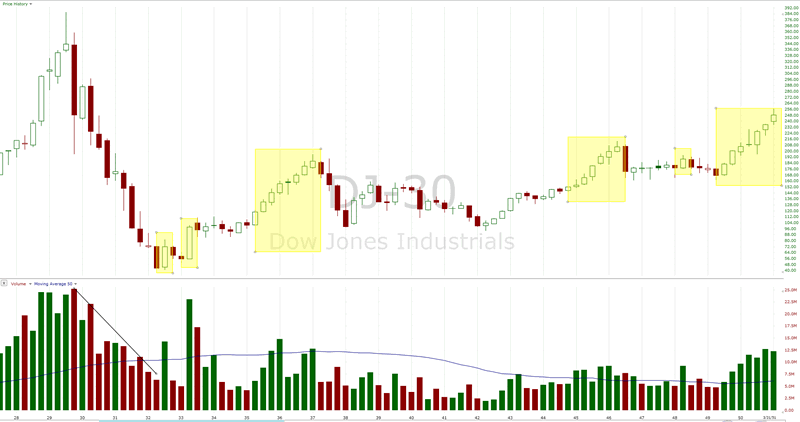
Historical precedent does not support the thesis that low volume and investor flight is a sign or condition of a nascent Bull market.
CONCLUSIONS
The current sentiment and psychology of the market, when taken together with the rigorous and thourough technical analysis provided in the latest BullBear Market Report, shows that there is simply no question whatsoever that the overwhelming weight of evidence indicates a strong potential for a near term crash of world financial markets. Certainly, there are many times when latent potential is not realized and there is a valid setup for a near term rally as well. But in an environment of psychological and emotional complacency the probabilities become heavily skewed towards a realized bearish outcome. Global financial markets are currently in a bona fide crash window and panic events similar to the 1987, 2008, 2010 or 2011 episodes are all very real possibilities.
There's an elephant in the room and no one wants to acknowledge it.

Disclosure: No current positions.
By Steve Vincent
Steven Vincent has been studying and trading the markets since 1998 and is a member of the Market Technicians Association. He is proprietor of BullBear Trading which provides market analysis, timing and guidance to subscribers. He focuses intermediate to long term swing trading. When he is not charting and analyzing the markets he teaches yoga and meditation in Los Angeles.
© 2011 Copyright Steven Vincent - All Rights Reserved Disclaimer: The above is a matter of opinion provided for general information purposes only and is not intended as investment advice. Information and analysis above are derived from sources and utilising methods believed to be reliable, but we cannot accept responsibility for any losses you may incur as a result of this analysis. Individuals should consult with their personal financial advisors.
© 2005-2022 http://www.MarketOracle.co.uk - The Market Oracle is a FREE Daily Financial Markets Analysis & Forecasting online publication.


