


Stock Market Dam Has Broken, As Massive Divergences End
Stock-Markets / Stock Markets 2012 May 21, 2012 - 04:33 AM GMT

 Last week, I left readers with the possibility of the US markets finding a low if they could hold support early last week, we were expecting a gap down towards 1333-1338ES, to finish a potential 5 wave decline from 1411ES.
It was then I was expecting some sort of rally to try and confirm the working ideas we had, well we got a rally (if you can call it that) but it was not what we were expecting for either the bullish or bearish ideas we were working, so much that we had to take invasive maneuvers quickly, the markets lack of strength was alarming and whilst we bought the lows around 1333ES twice, we simply never seen the sort of strength I was expecting, by Wednesday I had other ideas and made it known to members that failure to get above 1342ES (1340SPX) was a big issue and was very bearish, well the market failed to get above our area, in fact it struggled right at our 1342ES #, so much that is got us short and looking lower, and throwing away our initial ideas that we were working the start of the week and got us aggressively bearish.
That's call turned out to be a great call as it has yielded over 50 handles.
I was very bullish at the start of the week looking for an important low, by Tuesday I had my doubts, by Wednesday it was pretty clear the bulls had failed and as my motto says.
"If what you expect to happen does not happen get out"
Which is exactly what we did, we ditched the bull idea and flipped back to being short, as we had been short most of last week into 1333ES, the failure to get above 1342ES suggested the market has finally caught up with the massive divergences that have been seen on the forex risk markets as well as the European stock markets.
I have shown this chart before, but it's a very important chart and has kept us selling and remaining short European stocks and forex risk pairs.
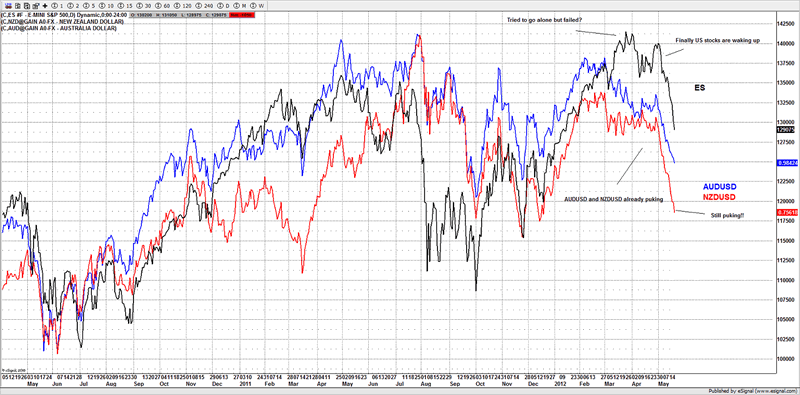
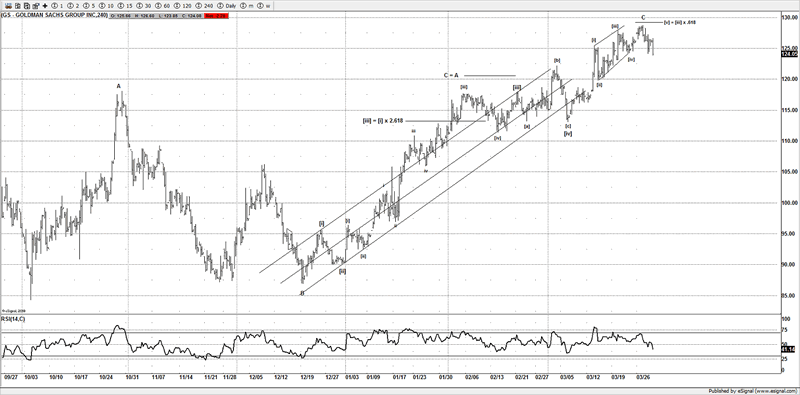
But what happened over the past 3 months was US stock markets held up as other markets were puking lower, which causing me no end of trouble, as the other markets were continuing lower it cast a doubt of the ideas with US stocks. I was still seeing breakdowns on some major stocks like GS and CAT.
However this week they finally played catch up and the arbitrage is closing between the markets.
The weight of other "risk on" markets was simply too much for the US stocks markets, although I had expected the US markets to roll over much earlier, if they had it would had made my job simpler, as the strength they had shown actually still setup a potential bullish move should the bulls have been able to hold support early this week.
But that is history the bulls have failed and it's my belief that we are on our way to see 1080-1050SPX and my primary wave count finally won out, although it really did test my patience.
Now that we have a road map it will make my job much simpler going forward over the coming weeks, as I am expecting another 200 points downside at minimum on the SPX.
Judging from the reaction so far it look like the bulls are praying for Ben Bernanke to come to the rescue them again and more QE, that maybe the case, but until such time I will continue with my ideas.
Most of the markets that rallied from the Oct 2011 lows should completely retrace that move that includes US stock markets, European stock markets (although some are already over 50% there) forex pairs like the AUDUSD, AUDJPY and NZDUSD, as well as see the USDCAD pair rally.
It was the USDCAD pair this week which gave us the vital edge we wanted and we had a level that once surpassed and broke out, the bulls in stocks were in big trouble.
That level was 1.0050, we were bullish stocks the beginning on the week if the USDCAD pair stayed under 1.0050, but as soon as it broke higher, we knew we needed to ditch the ideas of being bullish on US stocks and start selling again.
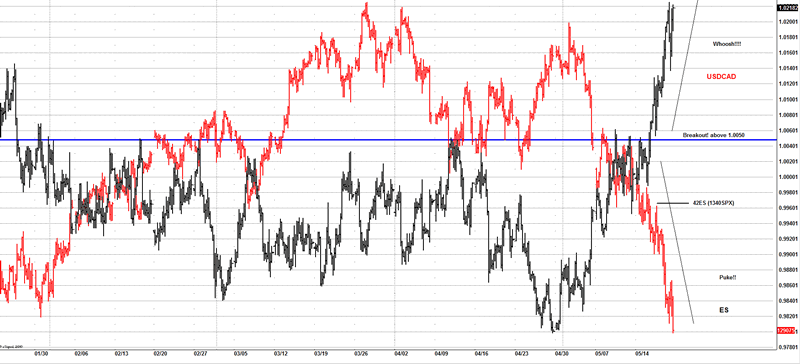
That turned out to be a great trade, the ES is down 50 handles from the USDCAD breakout and the USDCAD is up 160 pips.
Just having that little edge got me and members a trade and got us back short and ditch the bullish side of the trade.
Switching bias is as easy as a light switch as long as you are willing to accept ideas are wrong.
I would rather admit I was wrong quickly and get back on the right side of the move, than sit there and be stubborn fighting the trend, as I am sure many bulls did this week.
If you are reading this and you failed to recognize the weakness around 1340SPX earlier in the week, either you read the tape wrong, which is fine as we all make mistakes. Or you were ignorant of the market's weakness are refused to adjust.
The former is ok as long as you admit you are wrong quickly, the latter well.................. that's just poor trading. Being stubborn and not willing to admit you are wrong is a quick way to severe losses.
While other traders I suspected were trying to catch a falling chainsaw, we were sitting back and counting the $$$, trend trading can be so easy if you have the right skills and tool set.
I don't think this is finished by a long shot, I am looking lower and members have my key areas, as long as we are under those areas, we are aggressive sellers and focusing on our patterns.
Random markets huh! no chance, if you nowhere to look and can respect price action, this market will give you setups.
Of course you need to have the edges we have to keep you on the right side.
Gold
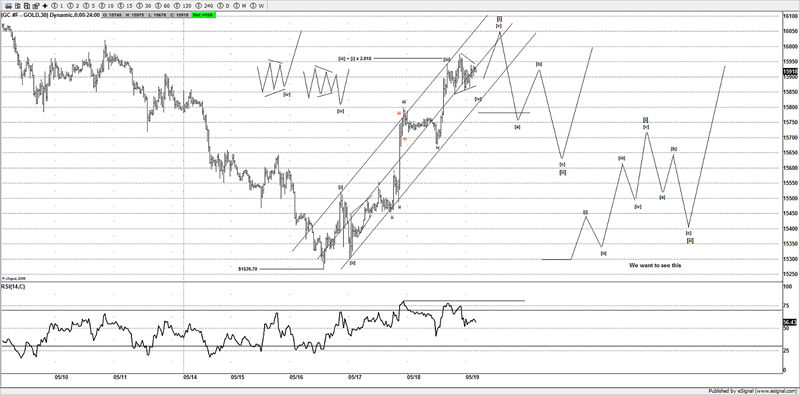
Gold potentially made an interesting low this week, so much as to say it could be a very big move higher setting up, although initially I was tracking gold with other risk markets, I was trying to use other markets to find a low.
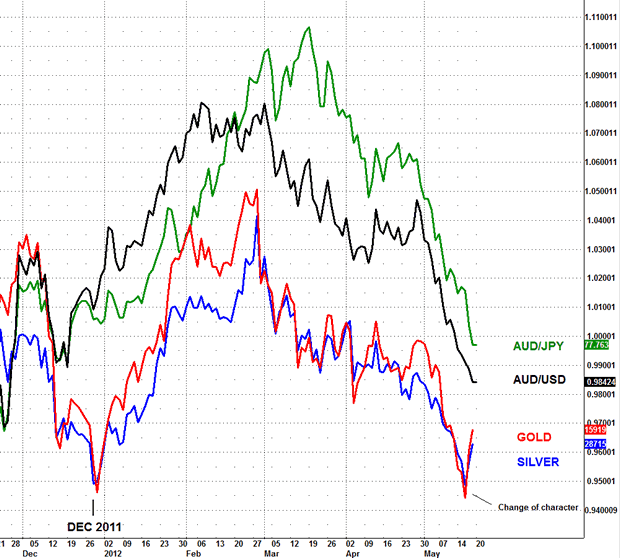
You will note the alignment of both silver and gold from the Dec 2011 lows. And as the other risk markets were puking I was starting to be alarmed that the selling going on in the other markets was pulling the precious metals lower.
Well that was until Thursday last week, something occurred and it could be a VERY important clue, the precious metals "went it alone".
Look at the chart again, do you notice something? Yes they stopped following the other forex pairs that they have been tracking for virtually 6 months.
Gold and silver broke free and held important support so much that on Thursday gold and silver were being bought as a fear play, the US$ was not involved, we saw new decade highs on bonds to over 148 (another target of mine hit) and the JPY pairs were going crazy, as it was clear it was a JPY carry unwind.
In the midst of all that we saw the precious metals get a bid, well it was more than a bid, it was seen in the HUI as well, which is further encouraging for the bulls.
With a potential 5 wave advance on gold, there is a very high probability that an important low is now in for gold, with the HUI hitting a long target and reversing strongly the next few days could yield a great opportunity to get long both in gold and the HUI.
Long term wave counts are reserved for members.
If you are interested in following my big picture ideas and looking for quality analysis then come and join, us as we approach this key period investors and traders need to be vigilant and focus and high quality low risk setups. Check out it out http://www.wavepatterntraders.com/topic/647-subscription-packages/page__pid__12411#entry12411
For $15 a month you get access to daily updates of gold silver and other commodities, I would be very surprised if you can find anyone or any service that offers the same value as we do.
Don't take my word for it; take the 4 week free trial.
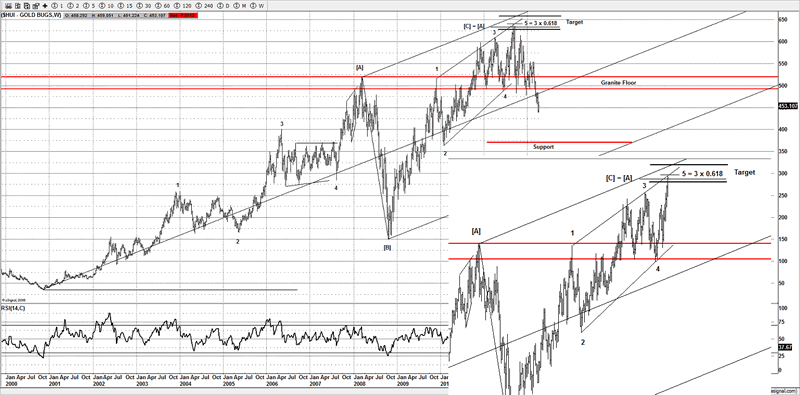
Members also get to follow the HUI as well, so if you're a gold bug trader I am sure having a helping hand won't do you no wrong considering that I nailed the high to virtually to the tick (don't think I saw anyone else top tick the HUI).
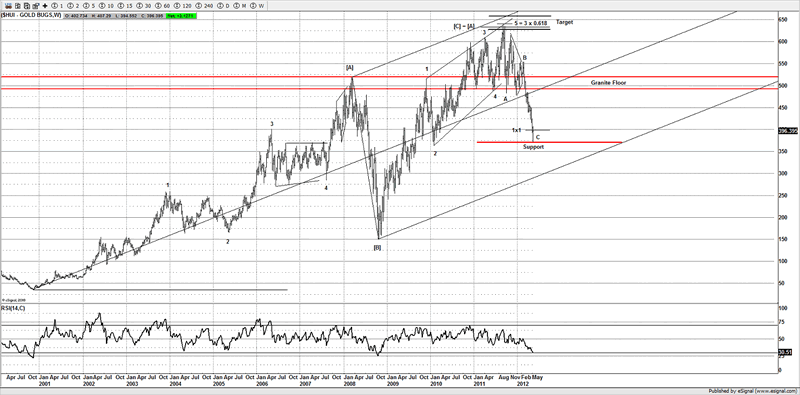
And the HUI has just hit a long standing target and reversed aggressively, bulls of gold stocks could have saved themselves a whole of pain as once a key area broke on my chart the 480-500 "granite floor" it was setup for more pain for the bulls.
Gold could just be at that point where it will surprise many.
HUI
Once it had broken the "granite floor" it was time to get out of gold stocks, if you had known about my key area, you could have saved yourselves a lot of pain.
Although I am sure some readers maybe were told by their brokers to stay in and it was just a correction. Well if your idea of staying in a market to ride the correction is losing 30%, be my guest to carry on with your broker, he/she clearly does not have your interests at heart, only wants to take the commissions no doubt.
If you look at the insert you can see how I virtually top ticked the HUI last year. (It also helped me top tick the gold high near $1900 last year).
You will also note the target highlighted via the red line.
Well it seems we have some buyers who can read a chart as well.
Is the correction over? Or it is part of a more complex move. That we won't know, but for now the strength shown in the HUI and gold is looking good for the bulls.
US stocks
Goldman
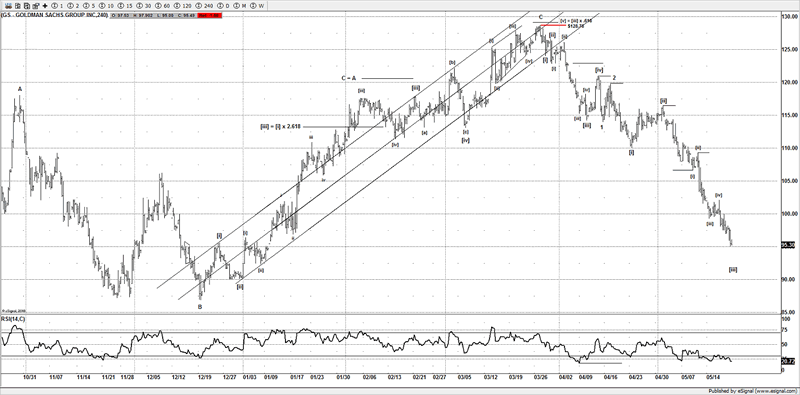
I have been tracking some big stocks in the US markets, and they having been slowing coming apart and I suspect they well find their ultimate targets eventually. It's looking good to reach its $85 target.
Before
After
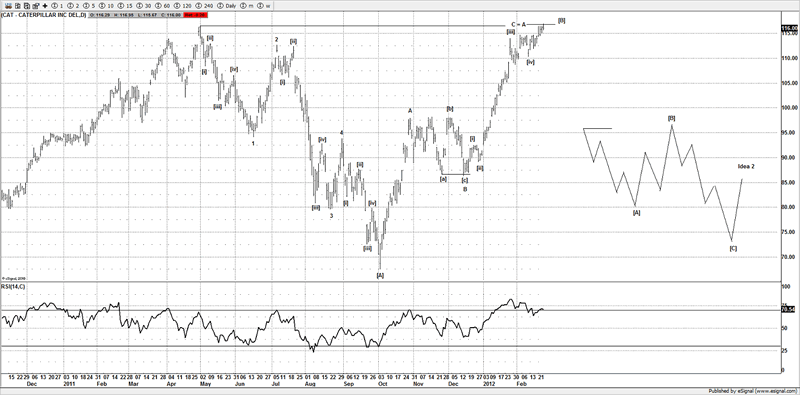
Another stock is Caterpillar
Before
After
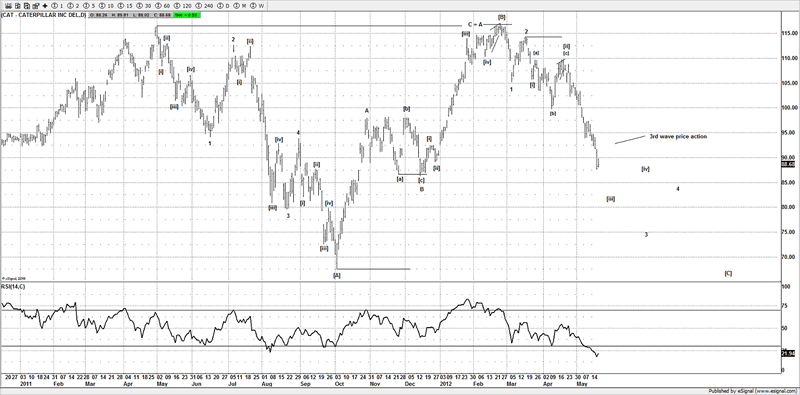
CAT looks like it wants to see the Oct 2011 lows again or lower; $65 appears to be targeted.
There are a few stocks that look ripe and ready to roll over big.
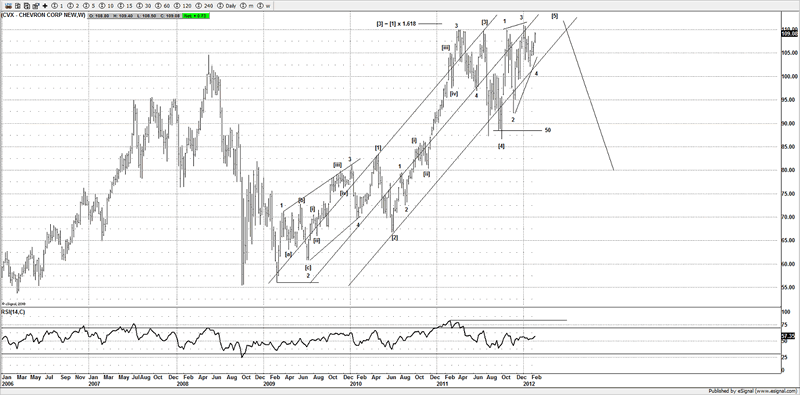
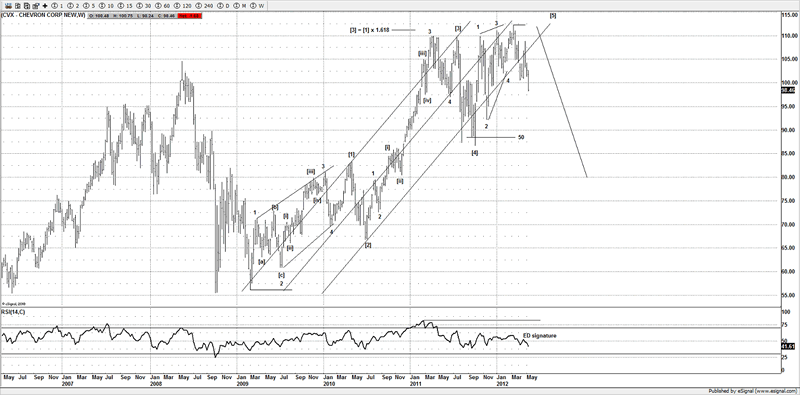
2 of them are CVX and IBM, both big cap stocks, and I am sure they will yield some sustainable gains over the coming months.
CVX
Before
After
IBM
Before
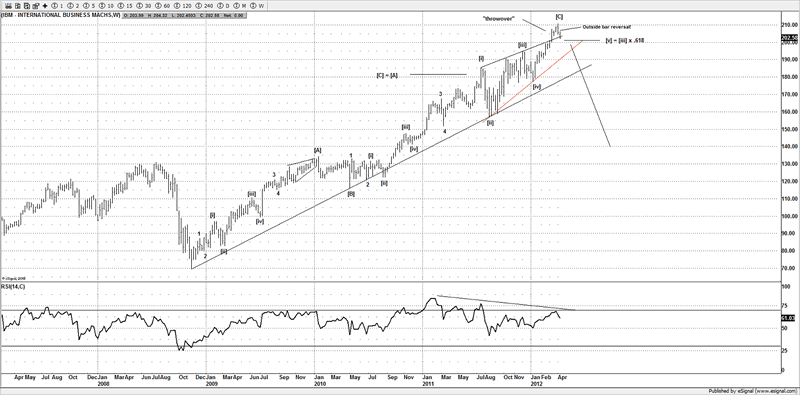
After
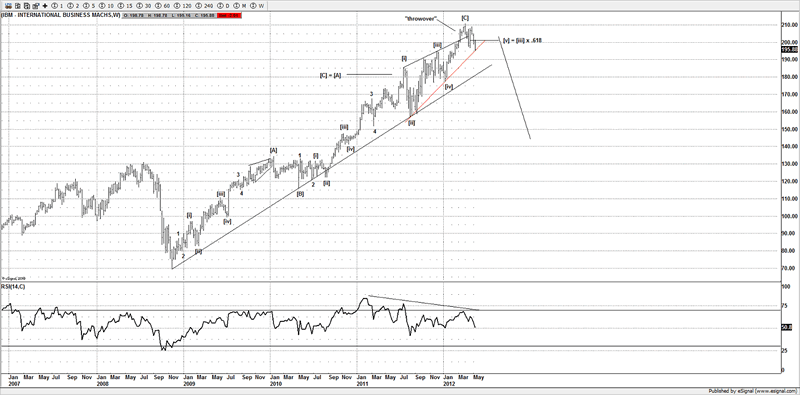
So just looking at those major US stocks suggests we have far lower to go in the US markets, some major stocks are already breaking down, and some are "just" on the edge to break down.
Seeing 1050SPX is not unrealistic after all, as I see many other markets to support the view.
Conclusion
The price action damage this week, has simply confirmed what I believed all along, as that the massive divergences between the US stocks markets and the other risk markets simply could not go on forever, and the damage seen this week confirmed that and brings the Oct 2011 lows in play and over the coming months I expect those to be hit.
The reversal seen from the HUI and the precious metals is very encouraging and I like to buy at the lows when it's nice and cheap and no one wants to buy and sell the highs when everyone wants to buy.
We have some good ideas in the metals and HUI and we are looking forward to next week to see if we can confirm those ideas.
Until next time.
Have a profitable week ahead.
Click here to become a member
You can also follow us on twitter
What do we offer?
Short and long term analysis on US and European markets, various major FX pairs, commodities from Gold and silver to markets like natural gas.
Daily analysis on where I think the market is going with key support and resistance areas, we move and adjust as the market adjusts.
A chat room where members can discuss ideas with me or other members.
Members get to know who is moving the markets in the S&P pits*
*I have permission to post comments from the audio I hear from the S&P pits.
If you looking for quality analysis from someone that actually looks at multiple charts and works hard at providing members information to stay on the right side of the trends and making $$$, why not give the site a trial.
If any of the readers want to see this article in a PDF format.
Please send an e-mail to Enquires@wavepatterntraders.com
Please put in the header PDF, or make it known that you want to be added to the mailing list for any future articles.
Or if you have any questions about becoming a member, please use the email address above.
If you like what you see, or want to see more of my work, then please sign up for the 4 week trial.
This article is just a small portion of the markets I follow.
I cover many markets, from FX to US equities, right the way through to commodities.
If I have the data I am more than willing to offer requests to members.
Currently new members can sign up for a 4 week free trial to test drive the site, and see if my work can help in your trading and if it meets your requirements.
If you don't like what you see, then drop me an email within the 1st 4 weeks from when you join, and ask for a no questions refund.
You simply have nothing to lose.
By Jason Soni AKA Nouf
© 2012 Copyright Jason Soni AKA Nouf - All Rights Reserved
Disclaimer: The above is a matter of opinion provided for general information purposes only and is not intended as investment advice. Information and analysis above are derived from sources and utilising methods believed to be reliable, but we cannot accept responsibility for any losses you may incur as a result of this analysis. Individuals should consult with their personal financial advisors.
© 2005-2022 http://www.MarketOracle.co.uk - The Market Oracle is a FREE Daily Financial Markets Analysis & Forecasting online publication.