


Stock Market Interim Rally Directly Ahead
Stock-Markets / Stock Markets 2012 May 21, 2012 - 09:02 AM GMTBy: Andre_Gratian

 Current Position of the Market
SPX: Very Long-term trend - The very-long-term cycles are down and, if they make their lows when expected (after this bull market is over) there will be another steep and prolonged decline into late 2014. It is probable, however, that the steep correction of 2007-2009 will have curtailed the full downward pressure potential of the 120-yr cycle.
SPX: Intermediate trend - Now that the correction has gone on for nearly three months, it is time to say that it is of intermediate nature - and most likely incomplete!
Analysis of the short-term trend is done on a daily basis with the help of hourly charts. It is an important adjunct to the analysis of daily and weekly charts which discusses the course of longer market trends.
Market Overview
By "line in the sand", the title of the last newsletter, I was referring to the 1340 level. We now know that it did not hold and that the correction has dropped prices to a lower level. In fact, they have reached (and slightly surpassed) the 1305 price target which was estimated to end this phase of the projection. The (5/20) time target has also been reached, so we should be looking for an interim rally to take hold. However, this is not likely to be a bona fide reversal because the full correction is estimated to take us down to about 1245-1265 by the middle of June and, technically, the correction does not look complete.
The end of this phase of the decline was expected to be marked by the bottoming of the 33-wk cycle, estimated to be on Sunday 5/20, and I had mentioned earlier that we could look for a low either last Friday or Monday. Last week's action could be construed as a minor selling climax -- especially the last three days of trading when about 85% of the hourly trades made a lower low.
The last trade of the day on Friday ended in a candlestick pattern which can be interpreted as neutral and is often seen at reversal points, with breadth showing positive divergence as well. Of course, these are only warning signs which took place at the hourly, not the daily level. Prices will have to turn up to confirm that a low has been made, and there is a short-term cycle bottoming next week that could affect the "ideal" time frame for the low of the 33-wk cycle. Unless smaller cycle bottomed early, it could either prolong the decline by another couple of days, or bring about a retest of the low.
Basically, we are in the time frame and at the price level when and where a relief rally should take hold; perhaps something on the order of 45 points, which would be the equivalent of a .382 retracement of the second phase of the decline.
As you will see as you continue reading, there are numerous independent indications that we have arrived at the end point of the decline.
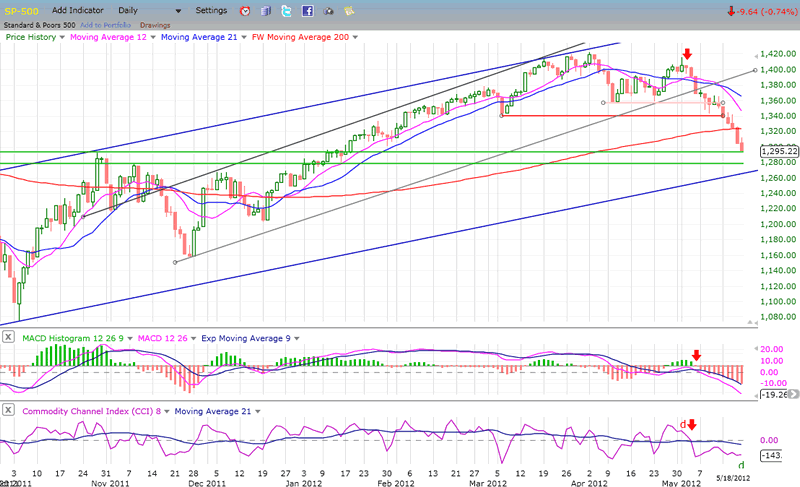
Chart analysis
A couple of weeks ago, I mentioned that the SPX (Daily Chart below) was in the process of shifting its trend from the narrow grey channel to the wider blue channel, and this is precisely what has happened. The tendency is for an index to go fractionally beyond the bottom trend line of a new channel before reversing. Since I am expecting this to occur between 1245 and 1265, dropping to this level would be ideal. But not before we first get a bounce off the support lines that have been drawn in green.
These lines represent a strong support area, especially for an index which is as oversold as this one is, and whose short-term indicator (CCI) has been showing deceleration and positive divergence (d) for the past few days. Add to the bottoming of a cycle and the filling of a price projection that this is occurring at the time of an eclipse! It's amazing how all these diverse factors come together when a reversal is about to occur. I don't think that there is anything "random" about the stock market.
You will note, however, that because of the relentless nature of the decline, the MACD (which is a longer-term indicator) still does not show any deceleration, even in its histogram.
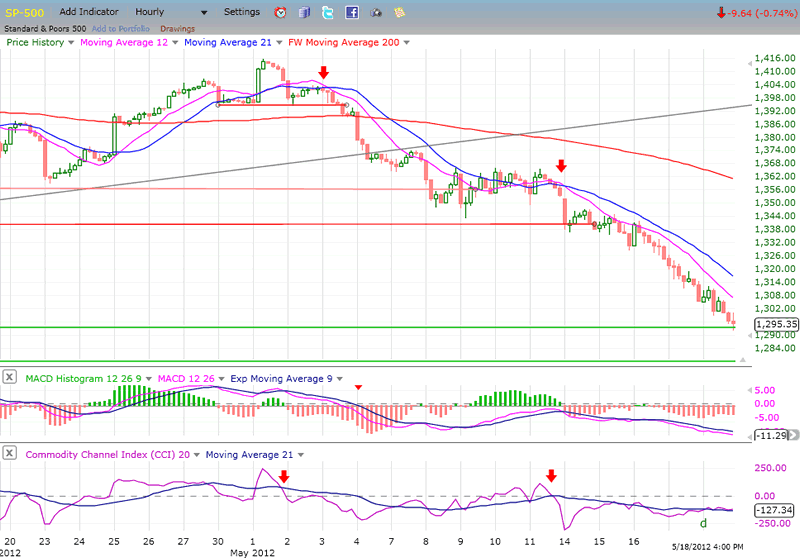
On the Hourly Chart, you can observe how the SPX broke three support levels before coming to rest on the current one, at 1292. It started with the small H&S at the top and the break of its neck line at 1394. This was followed by the violation of the 1359 level, where prices managed to hold off for three weeks before moving below 1340.
O the Daily chart, I noted that some deceleration and divergence was evident on the CCI. On this chart, it is even more so! In fact, after crawling along the longer MA, it has almost managed to achieve a bullish cross. Even the MACD histogram is showing a pattern of deceleration. And, look at the last candle on the chart. If reflects buyers and sellers reaching an equilibrium which could encourage bargain hunters to step in on the next trade.
Let's move on, because there are even more bullish signals to consider.
Cycles
This is what was written in last week's newsletter:
"...This most likely means that the half-cycle of the 66wk cycle will be a low instead of a high this time. Since it tends to be fairly regular, we should expect it to bottom around 5/20."
"Around the time that it makes its low, the 33-wk cycle will be joined by an 11-wk cycle."
Going forward into mid-June (which is, incidentally, when the next Greek election takes place) there will be cycles bottoming practically every week. This may result in a more volatile deceleration process going into that date rather than a sharp rally followed by a another sharp decline.
Breadth
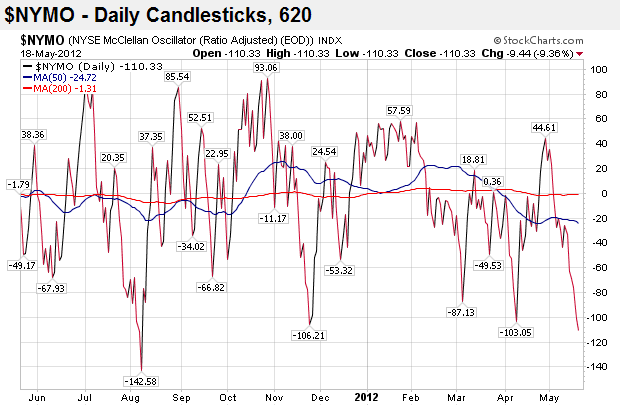
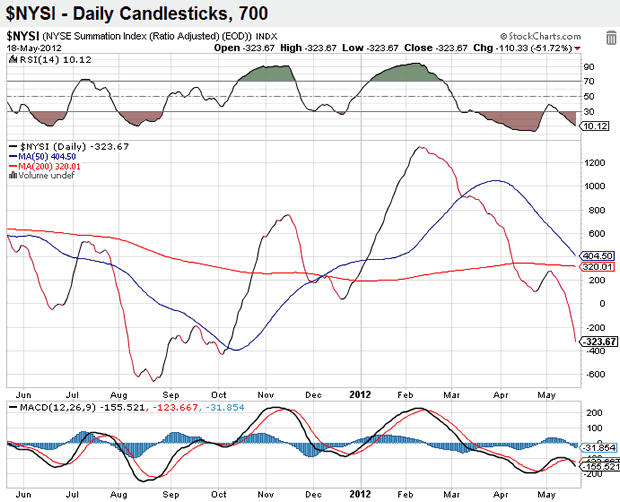
The McClellan Oscillator and the Summation index (courtesy of StockCharts.com) are depicted below. From these two charts, we can deduce that 1) the McClellan oscillator is extremely oversold and in an area from which it normally has a sharp rebound, and 2) the lack of an apparent low in the NYSI suggests that the correction has not yet concluded. But, due to the position of the NYMO, an oversold rally can be expected, especially with the NYSI RSI showing strong positive divergence.
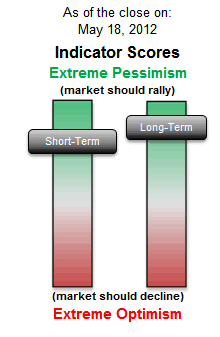
Sentiment Indicators
Recently, I have begun this section with the VIX analysis. Not today! It's time to look at a sentiment indicator (an old friend) that has a great record of calling important tops and bottoms. The SentimenTrader (courtesy of same)was placed on the back burner until it was ready to grab our attention -- and is it ever doing that now!
The long-term indicator does not get much closer to the top of its range before the market ends its decline and has a reversal. When we were at the market high, this indicator was deeply into the red. Now, it has shifted 180 degrees and it's time to break away from the bearish crowd and do the opposite of what they are doing.
And in case you are not completely convinced, the short-term indicator is telling you the same thing. This is a signal that needs to be heeded if you are short the market.
The VIX
Another favorite in identifying turns is the VIX. It normally makes a pattern which is the opposite of the SPX and, very often, it deviates from matching the SPX in reverse at a top, or at a low.
This is an hourly chart of the VIX and, as of Friday's close, it does not show any divergence from the SPX. Perhaps "this time it's different" or, perhaps it simply means that the SPX is not ready to reverse just yet. It could also be a matter of refinement. I mentioned that there were two cycles involved in the coming low. Perhaps they won't bottom together exactly, and perhaps the divergence will appear at the second low. Another possibility is that this will not be an important low (which is what we expect), but only an oversold rally from here, not the end of the correction where the divergence is more likely to appear. However, the CCI does show the same deceleration and divergence pattern that is shown by the SPX.
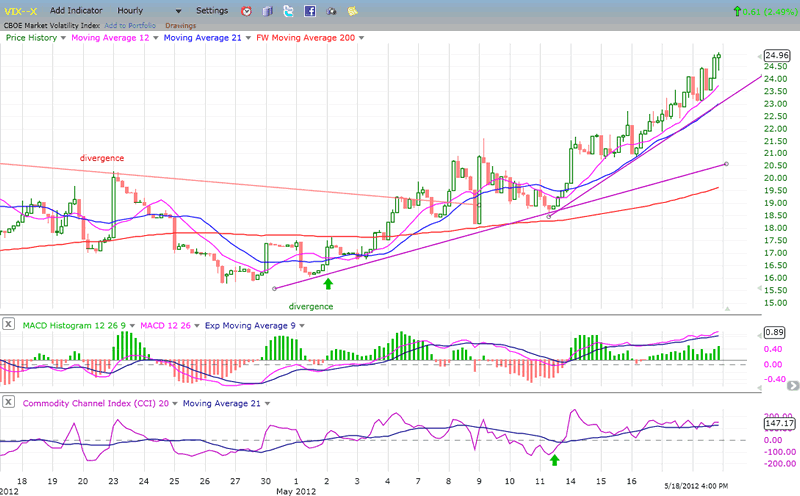
The Point & Figure chart also suggests that 25 might only be a phase count and that the total correction could take it to at least 29. A liberal count could even exceed that price.
XLF (Financial SPDR)
The XLF break of the support level was triggered by the JPM fiasco. It never recovered; nor did the market. During the decline, it has matched the SPX step for step, and has more often than not been ahead of it, being the first to move lower. Now, the indicators may have given a subtle, but significant warning that XLF is ready to turn. The CCI has already made a bullish cross while the MACD histogram has steadily been moving higher.
By the way, have you noticed that the VIX and XLF have made the same candle pattern as the SPX during the last hour on Friday? That's at least, interesting -- and perhaps significant.
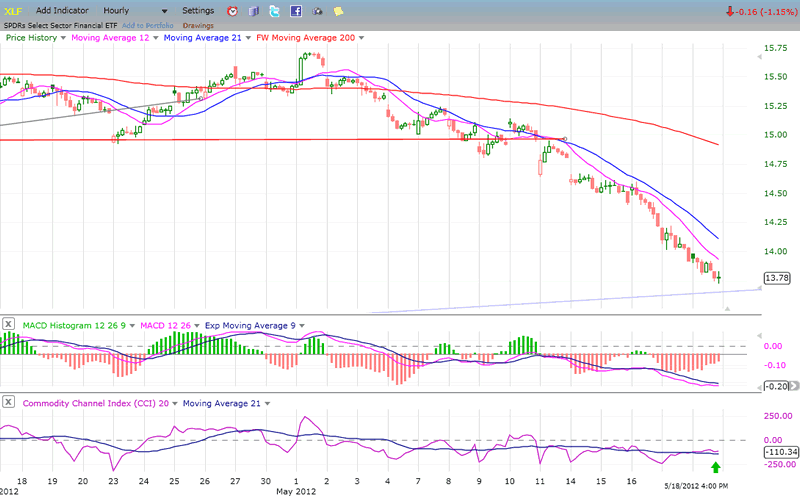
XLF has a lower P&F projection. Not too much, but enough to suggest that if (when) there is a reversal from this area, we may not be finished with the correction.
By the way, the blue channel that I show on SPX has a close relative on XLF. The pale blue line that you see at the bottom of the above chart is not the bottom of that channel. It's a parallel to it which could afford some support. The main line is about another 50 cents lower- which pretty much corresponds to the P&F count.
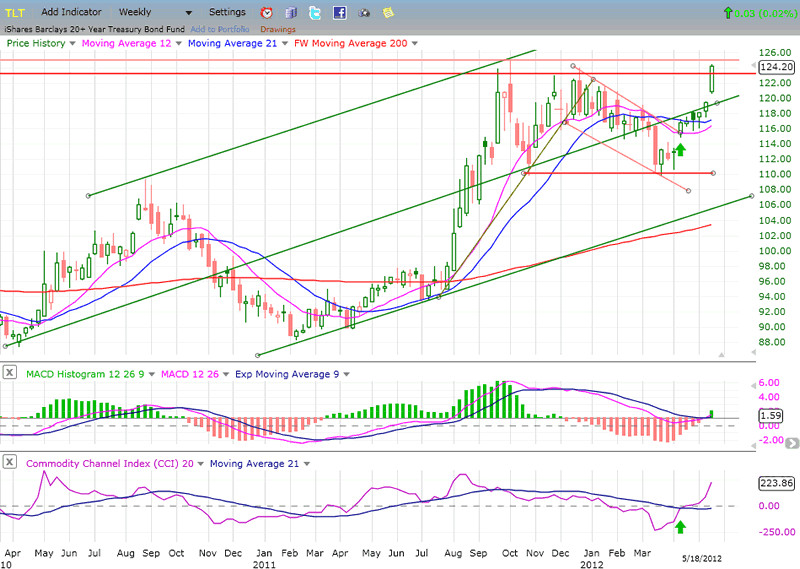
BONDS
Would you say that TLT is still in a long term uptrend? I would! And would you also say that it has reached an area of strong resistance? So would I! Furthermore, there is no divergence in the indicators, which means that the index is likely to go ahead and make a new high eventually - but not right away! The hourly chart shows that currently it is extremely vulnerable to an imminent correction -- another indication that the SPX is ready to make a low.
I could speculate on the future of TLT and of the stock market by looking at this chart. Most relevant is that what I had originally taken for a distribution pattern is turning out to be a re-accumulation phase, indicating that the index is not anywhere close to its high. And why isn't this a surprise since this is what the 2009 base on the P&F chart had suggested all along? But that analysis is for another day. For now, TLT is probably done and needs to correct.
UUP (Dollar ETF) Daily Chart.
This is what I wrote last week, and it is also worth repeating:
"As long as UUP continues to move up, it will continue to put downward pressure on gold, oil and, most likely, the equity indices as well. UUP represents what the US dollar is doing, and we know that between May and September of last year, the dollar established a base which gives us a count to 90. All P&F projections represent a potential and not a guarantee but, as long as it does not start a significant decline, the dollar can be expected to continue its move toward that objective and eventually reach it. Regarding the dollar, the P&F count of its re-accumulation base gives it a near-term potential target of 85/86. If it is reached, it would put UUP at about 23.80. The re-accumulation pattern that you see on UUP also calls for a target of 23.80. That's the math! We'll see whether or not it materializes."
This index, perhaps better than any of the others, is pointing to an imminent low in the market. It has already peaked near-term, preceded by gold, as you will see later. That does not mean that it will reverse in a significant downtrend right away but, rather, it is probably only going to consolidate for a while and resume its uptrend until it gets to about the 23.80 level. If it does that, the SPX should then move down to finish its correction by declining into the 1245-65 projection.
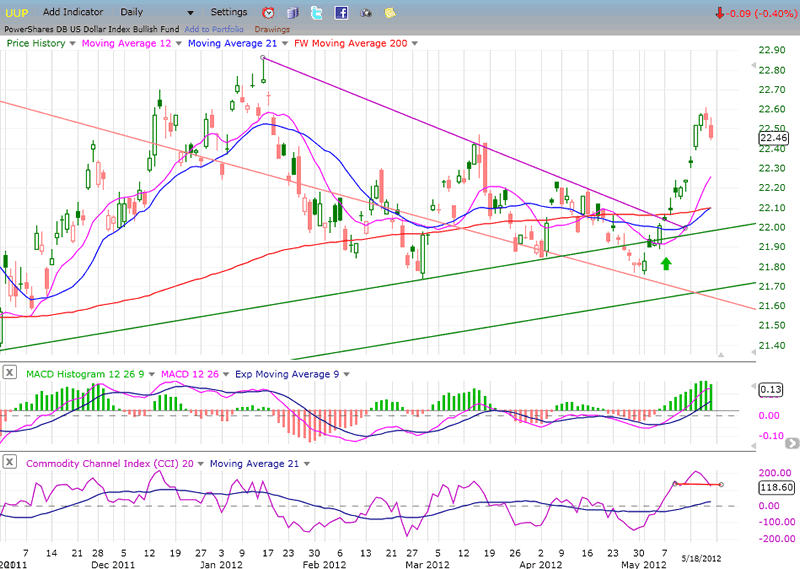
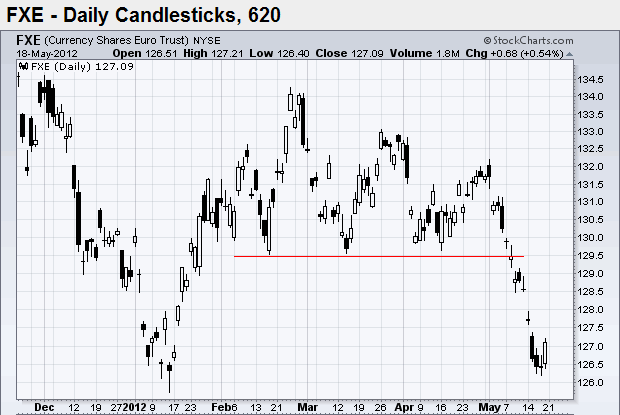
As you can see, having found a temporary low, the Euro is doing the opposite. It's pattern should continue to follow the reverse of UUP until it has made a lower low when UUP reaches its 23.80 projection.
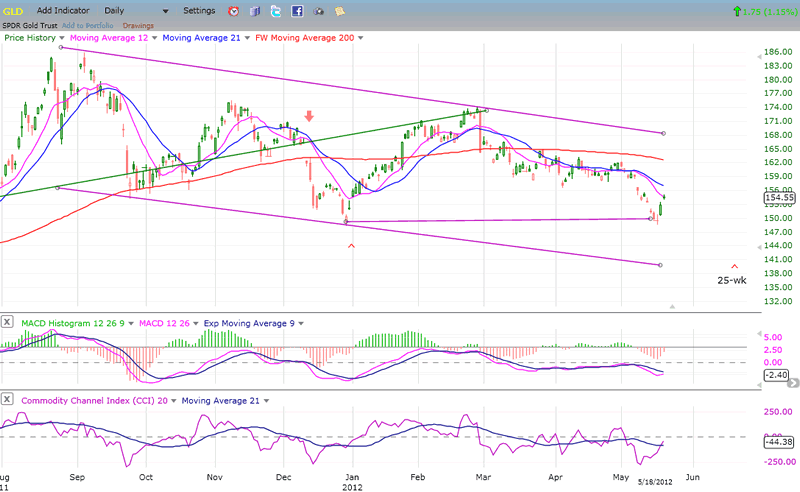
GLD (ETF for gold)
From last week:
"It's possible that prices will find some temporary support at their former cycle low, but since, at 141, the correction would have retraced .382 of its advance, and that this is supported by a P&F count, it is probable that this is where the index will find itself in mid-June.
This is in fact, what has partially already happened. GLD had a near-term count on the P&F chart to 149 which corresponded with support at the former 25-wk low. It's likely that this is only a near-term bounce and that after what could be a wave 4 consolidation, the index will decline into the 25-wk cycle low scheduled for mid-June.
Of course, this is also the most probable time frame for the end of the SPX correction, and for UUP to complete its uptrend to the suggested target price.
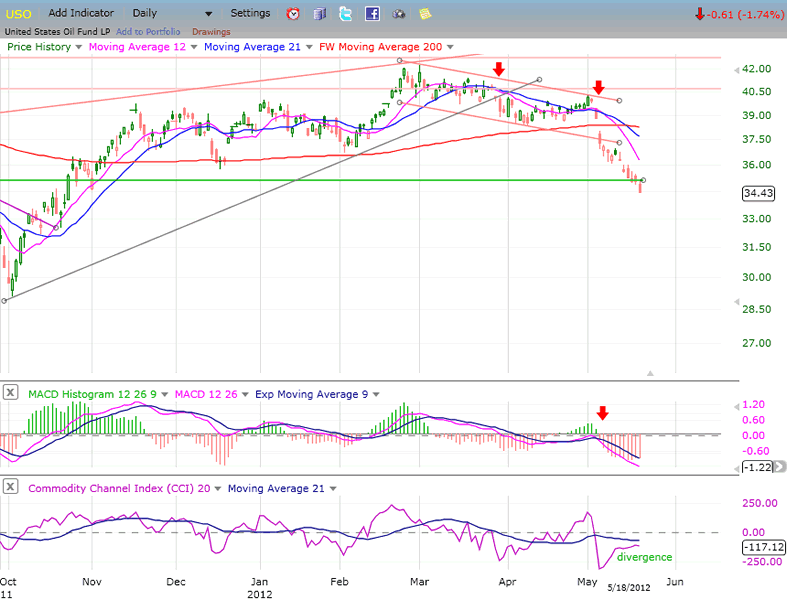
OIL (USO)
Both USO and WTIC have exceeded their interim P&F targets by a small margin and, in the process, USO has moved a little beyond its support level. Nevertheless, USO is expected to hold this level of support. It has only broken below the very top of the support area and, with every down-tick, it will meet with more and more support.
With UUP already having started a near-term consolidation, it is likely that commodities in general will pause in their current downtrend.
Looking at the indicators, CCI is showing positive divergence and the MACD histogram has started to lift, pointing to some deceleration process. Of course the background news is not favorable at this time. President Obama is trying to coordinate a strategy with European nations to release some of their petroleum reserves if oil prices get out of hand. This could delay the recovery of crude.
Summary
5/13/12 "The above charts uniformly show bearish patterns which portend lower prices over the next few days.
The cause of the downward pressure at this time is primarily the bottoming of the 33-wk cycle which is due to make its low around 5/20. Since that date falls on a Sunday, we might expect the decline to end either Friday or early the following week - or whenever the SPX reaches its next P&F projection.
While this could be the end of the correction from 1422, it is also possible that, because of the current cyclical configuration, it might not be over until mid-June."
Last week's summary turned out to be correct, and the SPX has now reached price and time targets which should trigger a relief rally, but this could be delayed by a couple of days by a shorter cycle bottoming on Wednesday.
FREE TRIAL SUBSCRIPTON
If precision in market timing for all time framesis something that you find important, you should
Consider taking a trial subscription to my service. It is free, and you will have four weeks to evaluate its worth. It embodies many years of research with the eventual goal of understanding as perfectly as possible how the market functions. I believe that I have achieved this goal.
For a FREE 4-week trial, Send an email to: ajg@cybertrails.com
For further subscription options, payment plans, and for important general information, I encourage
you to visit my website at www.marketurningpoints.com. It contains summaries of my background, my
investment and trading strategies, and my unique method of intra-day communication with
subscribers. I have also started an archive of former newsletters so that you can not only evaluate past performance, but also be aware of the increasing accuracy of forecasts.
Disclaimer - The above comments about the financial markets are based purely on what I consider to be sound technical analysis principles uncompromised by fundamental considerations. They represent my own opinion and are not meant to be construed as trading or investment advice, but are offered as an analytical point of view which might be of interest to those who follow stock market cycles and technical analysis.
Andre Gratian Archive |
© 2005-2022 http://www.MarketOracle.co.uk - The Market Oracle is a FREE Daily Financial Markets Analysis & Forecasting online publication.