


Stock Markets Heading for a Blood Bath Next Week
Stock-Markets / Stock Markets 2012 Jun 03, 2012 - 12:26 PM GMTBy: Sam_Chee_Kong

 Well since our last analysis last week, both fundamental and technical aspects of the markets have since deteriorated much. On the technical perspective markets seems too weak to produce any meaningful rebound although all of them are in oversold conditions. The barrage of bad news coming out from Europe only helped to worsen the situation. Yesterday’s stock markets performances have been awful to say the least. The DJIA and S&P 500 had their worse 1 day drop this year.
On the technical side what we foresee in the coming weeks is that the markets will be push down to its limits, it will be like exerting maximum pressure on a spring. You can only press it down for that long and that low, the longer and lower you press the spring the more pressure you are exerting on it. Hence when you release your hand the force of the rebound will be very powerful. This is exactly what is happening currently to the Global Stock Markets where some indexes have been dropping more than 20% from its peak (considered bear run) and yet any signs of a rebound are no where to be seen.
Again, when the next rebound occurs we will expect it will behave like the rebound of the spring that we mention earlier. Market makers are doing a great job in keeping the markets down so that they are able to fill up their portfolio at a song. When they are finally filled, good news will be disseminated and the long awaited rebound will begin and just in time for them to unload.
On the fundamental side of the equation, things are not too encouraging as well. Just look at the following headlines.
- According to the Business Herald there had been reported a bank run in the Chinese city of Wuyishan. Long queues of people waiting to withdraw money from the Chinese banks such as the Agriculture Bank of China, China Construction Bank and the ICBC Bank. More on China. The Chinese version of the PMI (Purchasing Manager’s Index) fell 2.9 points from 53.3 in April to 50.4 in May. Nevertheless, a drop in the value of 2.9 represents a contraction in the level of economic activity. The level at 50 represents the equilibrium and anything below it means there is a possibility of a recession.
- India’s economy is not out of the woods yet, in fact it performed much worse than expected. India’s economy took a dive from recording a 10% growth in 2010 to an expected 5% growth this year. This represent a 50% drop in economic growth and officials from the Indian Economic Research Group is already panicking and are now finding ways to prevent any further deterioration in the economy.
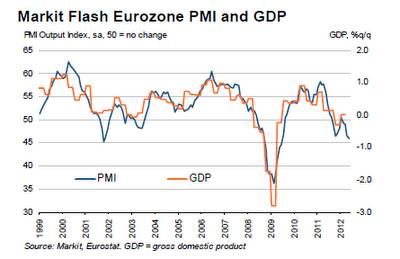
- The ongoing financial crisis in Europe had dampened the prospect of any economic recovery in Euro Zone countries. In fact quite a few of the recording negative growth in manufacturing. Manufacturing output in Greece fell by 14%, Spain fell by 4.6%, Portugal by 3.6% and Italy by 2.6%. While manufacturing output in Germany grew by 3.7%, its May PMI dropped to 45 compared to 46.2 in April and it is a 35 month low.
According to Markit, the Eurozone PMI fell to a 3 year low and manufacturing output fell 8 times in the last 9 months. The following is the chart of the PMI and GDP growth for Eurozone.
Precious Metals and Treasuries are Decoupling
What we saw yesterday was there is a decoupling effect in the ‘safe haven’ investments from the share market. Previously prices of precious metals such as Gold and Silver and US Treasuries tend to follow the movement in the share market. However as of last night when the DOW fell 2.2%, Gold went up 4.4%, Silver up 3.5% and US Treasury 10 year Bond yields drop to 1.5326% which is historic low. Further fear of a fallout in Europe and slowdown in large emerging economies like China, Brazil and India will further push down the bond yields as the demand for ‘Safe Haven’ investment increases.
When safe haven investments are decoupling from the share market will mean that investors are pulling funds out of the share market. In fact as of end of last year Bloomberg’s Insider Selling ratio was 3700 : 1. This means there are 3700 sellers to 1 buyer in the equity markets which signals ‘smart money’ are getting out.
The VIX indicator
The last time such an event happened was during the height of the 2008 financial crisis where the Treasury Bond yields temporary went below 0%. So all in all we expect more volatility in the Global Stock Markets in the coming weeks. Speaking of Volatility lets revisit the VIX indicator which is also known as the Fear indicator.
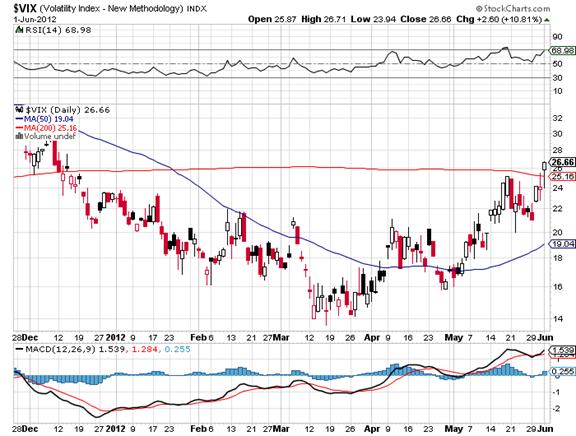
As you can see from the above since our last write on the VIX on 27/05/2012, the reading was at 19.67. Since then due to some unstable developments in Euro Zone it helped drive up index to close at a high of 26.66. It is just less that 4 points to 30 where anything above 30 represents increased volatility in stock markets.
What in store for Asian Markets next week? Blood Bath…
This week our focus will be Asia since the Asian markets will be the first to open next week. Well things cannot be optimistic in Asia next week when the markets in Europe and US are plunging in their last day of trading on last Friday.
Let’s take a look at the grand daddy of all markets which is the Dow Jones.
Dow Jones Industrial
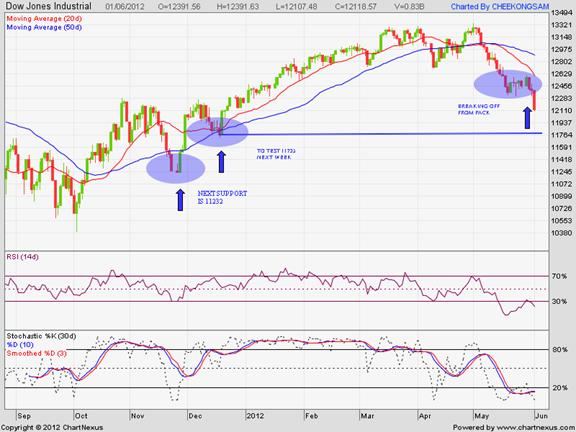
As you can see from the above since last Friday’s 2.2% drop, the Dow had already broken away from the support pack. It is now vulnerable to more weakness and we will expect it to test its second support at 11735 next week. Due to the lack of base building in the next support level at 11735, we doubt the Dow can hold on much longer at that level. The large red candle from the breakout from the pack represents a very bearish sentiment in the NYSE and we expect further deterioration in the Dow next week.
Europe - German DAX
European Markets are being brought down by Germany DAX’s massive 3.4% dive.
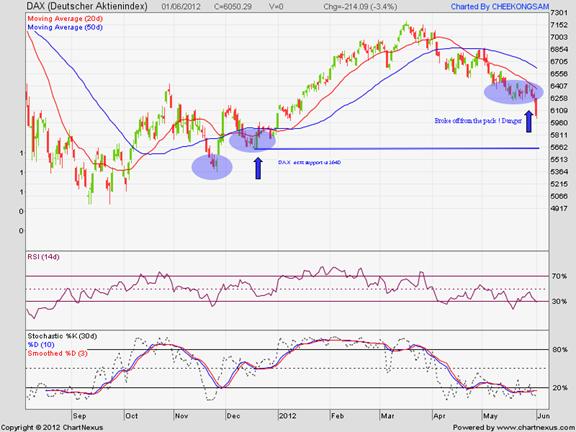
As from the above since it broke off from the support pack, we expect the DAX to further test its next level at 5640. There is more room for further decline in the DAX as evident by the large red candle during the breakout from the pack and also the RSI indicator is not too oversold. So we expect further decline in the European Markets next week unless there are good news coming out from Europe during the weekend.
Let’s take a look at some selected Asian Markets.
Australia – All Ordinaries
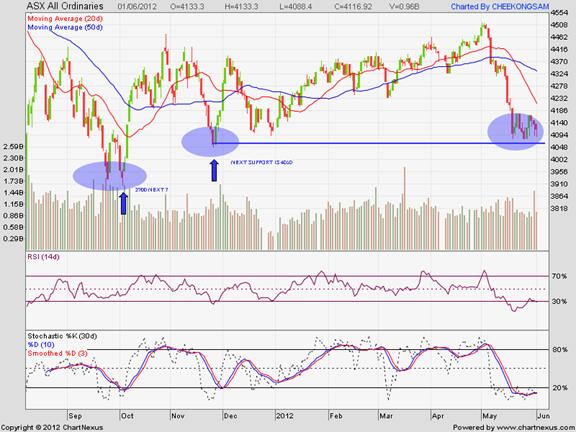
We expect the All Ordinaries to test 4050 level and if it cannot hold then 3900 will be the next level.
India – Bombay Sensex
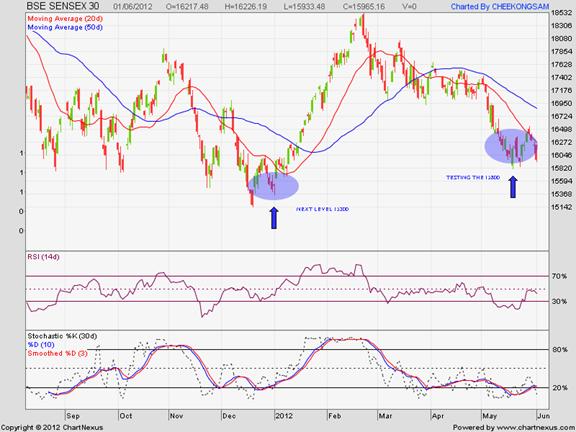
Again in line with our predictive space since the beginning of May, the Sensex will be testing the first support at the 15800 level which we think will be breach by next week. The second support level to be tested is at 15300.
Hang Seng Index
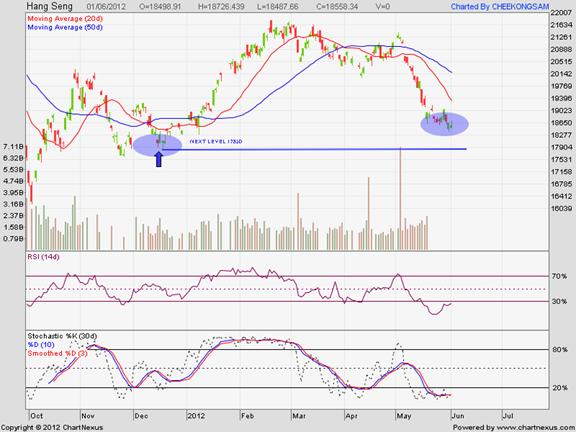
We expect the Hang Seng to test the support level at 17850 points next week. Followed a weak rebound last week, we see further deterioration in the Hang Seng Index next week.
Japan’s Nikkei

In line with our predictive space since the beginning of May, the Nikkei will be heading towards the 8135 level. In fact a few of the readers raise doubts when we first predicted the Nikkei will head towards 8135 when the Nikkei was at 9500 points.
Singapore – Straits Times
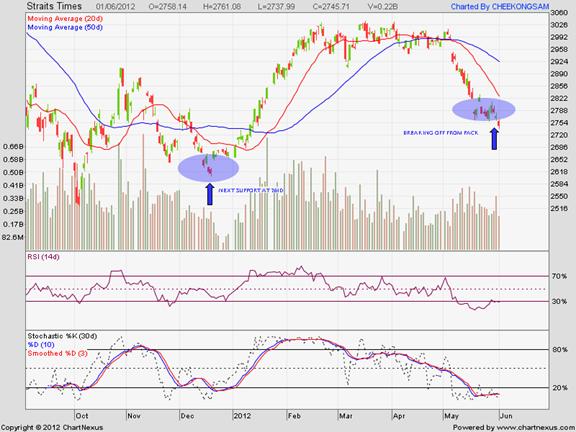
We expect the Straits Times index to test the 2610 support next week since it broke off from the Pack. The index managed to rebound slightly last week but falters towards end of the week due to poor sentiments and negative development in Europe and U.S.
Jakarta Composite Index
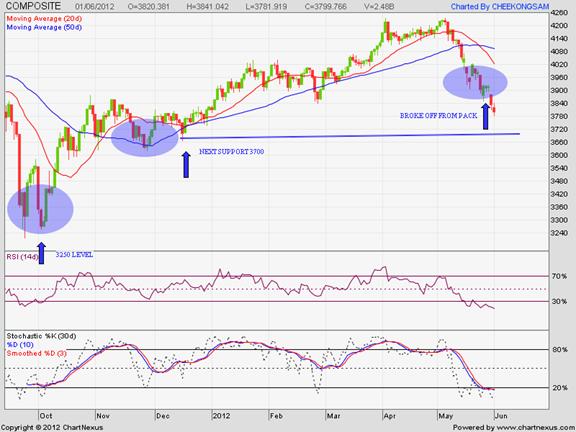
Jakarta Stock exchange is in line with our predictive space since last month which is going into a free fall. It looks like more in store for JCI to fall next week. As we have warned last week the next shoe to drop in the Indonesian Market is the 2nd and 3rd liners. Expect big reversals in the 2nd and 3rd liners next week as more margin calls will be on the way.
The reversal in the Indonesian market can be very brutal as evident during the last financial crisis in 2008. It can decline for more than 10 days in a row and stocks can decline by more than 90% from their peak. One of the few markets that can rival the volatility of the Indonesian Stock Market is the Vietnamese and some African Stock Exchanges. The Stock exchanges in Hanoi and Saigon allow unlisted companies to trade in their exchanges. These unlisted stocks can have a trading range of up to 80% both ways in a normal trading day. This is what we call volatility.
All I can say is we are just beginning to see such brutal decline ala 2008 again. So expect more BLOOD BATH in the Indonesian stock market next week. The next immediate support we are looking at is 3700 which we doubt can hold next week.
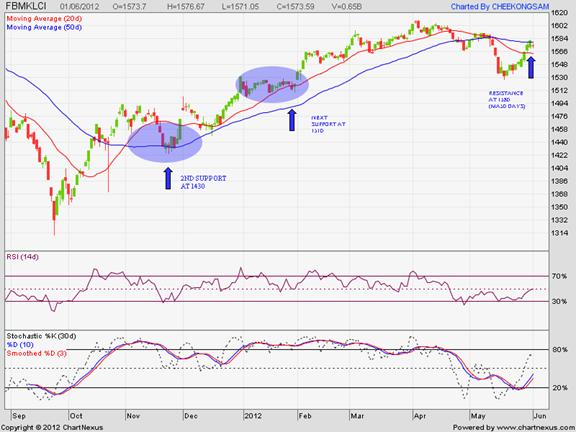
Kuala Lumpur’s KLCI
Manipulation of the Malaysian Stock market
There is an interesting development in the KLCI. We suspect that the KLCI had reached an intermediate TOP at 1580 which is located in the 50 days Moving Average. We expect the KLCI to correct downwards next week to test the recent low of 1526. Since the MA20 is already below the MA50 days since 14/05/2012, the KLCI is still considered to be bearish bias.
What we saw for the past weeks was the Malaysian Plunge Protection Team (PPT) working overtime just to maintain the index in positive territory. They have been manipulating the index by last minute buying of large cap index linked stocks like Telekom Malaysia, Maybank and Tenaga Nasional. However further effort to support the market will depend how deep the pockets of the PPT. naturally these large cap stocks have very big weightage on the KLCI. A single bid movement each way can contribute to a 1 point movement in the KLCI. So by concentrating their effort to manipulate these few counters, they are able to control the direction of the KLCI.
Create a ‘feel good’ and conducive environment
As far as we know the current attempt to support the stock market is the attempt by the authorities to show the public that our economy is still strong and can withstand any external shocks. It will help create a ‘feel good’ feeling among its people as the 13th General Election is nearing.
As for any indication, history proves that the manipulation of any market will have its limits. You can only support the market for so long and further buying will negate any positive effects that can be derive from supporting the market. This is because The Law of Diminishing Returns also applies to Share Market manipulations. The previous Malaysian authority’s attempt to corner the Tin market and another foray into the manipulation of the foreign exchange market only end up in tears. The Malaysian Government lost more than RM 15 billion on the Tin market while its attempt to manipulate the Ringgit resulted in more than RM 26 billion in foreign exchange losses.
Historical examples of failed market cornering include The Hunt brothers during the late 1970s to early 1980s. The price of Silver was pushed up from $11 an ounce in September 1979 to nearly $50 an ounce in January 1980 by the Hunt brothers. At one time they are holding about 50% of the rights to deliver Silver during their manipulation of the metal.
Another example will be car manufacturer Porsche’s attempt to corner Volkswagen’s shares. As a result Volkswagen’s share sky rocketed and briefly became one of the most expensive companies in the world. However the attempt was failed due to the naked shorts performed on the company resulted in the departure of its CEO and Financial Director.
As a result we will foresee that any attempt by the PPT to manipulate the Malaysian stock market will not last long and will be futile. It will end up in tears and we will see a major correction in the Malaysian Stock Market very soon.
by Sam Chee Kong
cheekongsam@yahoo.com
© 2012 Copyright Sam Chee Kong - All Rights Reserved
Disclaimer: The above is a matter of opinion provided for general information purposes only and is not intended as investment advice. Information and analysis above are derived from sources and utilising methods believed to be reliable, but we cannot accept responsibility for any losses you may incur as a result of this analysis. Individuals should consult with their personal financial advisors.
© 2005-2022 http://www.MarketOracle.co.uk - The Market Oracle is a FREE Daily Financial Markets Analysis & Forecasting online publication.