


Stock Market Panic, What's Next?
Stock-Markets / Stock Markets 2012 Jun 04, 2012 - 07:18 AM GMTBy: Gordon_T_Long

 The questions nervously being asked during this market turmoil and onslaught of worrisome news is:
1. Are we experiencing an Intermediate-Term pullback or the beginning of a major Long Term move down?
2. How do you determine when and where a pullback might stop?
3. What should I be looking at to give me the correct perspective and what tools will help give me an investment edge?
It is too soon to answer #1 until we see the "whites of the eyes" of the global central bankers and how they will react.
Whether to QE III or not to QE III?
Smart investors will leave that to the central bankers and speculators and focus on questions #2 and #3. These questions we can answer!
Markets Moving Markets
Several methods can be used to help determine at what level the market will stop.
1. One technique is to combine multiple tools and methodologies. When several different techniques all seem to point to a specific area, it is wise to take notice.
2. Another method would be use #1 on multiple markets, as well as the market you are trading. When you see several markets all appearing to be due for a technical event at the same time, again it is wise to take notice.
3. Additionally, you can add another level of confidence by fully understanding what markets are actually directly affecting the one you are trading. This is a little trickier and requires much more diligence. This is where the pros spend their time.
Let's work through these, starting with what we know.
There are a few technical tools like Fibonacci that we know can be uncanny in doing retracement predictions, as the market respects this natural growth and decay cycle. The issue however, as with many tools, is that you get several choices to choose from. The tools you use seldom give you one answer, but, like Fibonacci retracements or Gann levels, you get a series of levels of interest.
In the case of the S&P we know the value of the $USD has an impact. In a general sense, as the dollar rises or falls, it takes more or less of them to equate the same value. The chart below of the $SPX and $USD show us this.
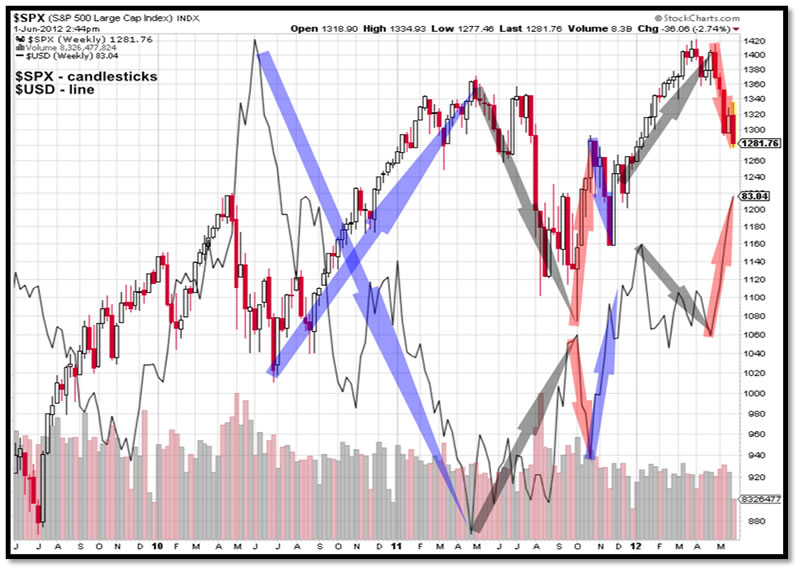
The line graph is the $USD and the candlesticks are the $SPX. Highlight arrows have been added to illustrate the point. We know when the dollar falls, more are required to equal the same value and it is reflected in the rise of the market. We also know when the value of the dollar rises, it requires less of them to equal the same value and the markets fall. This tells us we should be looking to the $USD and what it is doing. When it reaches technical areas and turns (or not) at them, you can expect the $SPX to do the same.
We also know that the $USD is also influenced by other markets. With a little investigation we will discover that presently it looks like it is the EURO/JPY that is the Driver$ for the $USD. There are a number of reasons for this, the Japanese Yen Carry Trade being but one example. Economic events in Europe right now are having an impact on the $EURO and these too influence the EURO/YEN. Through the EURO/YEN we are able to gauge the Economic effects of numerous events taking place at the same time. In turn, as shown in the chart below, the EURO/YEN influences or Drive$ the $USD.
This chart is the $USD superimposed on to the EURO/JPY. Each are own their own scale, but the dates line up and we can see the highlighted arrows again illustrating the point. Movement in the EURO/JPY causes an inverse reaction in the $USD.
Note the technical analysis that has been marked up. This analysis was done on the EURO/JPY. You can see the green highlighted box, marking a technically significant area. There are numerous reasons why it is significant, not the least of which is that it is back to the previous level low from Dec 2011. If you note the shape of the EURO/JPY from the Dec 2011 low, it is a near perfect triangle and gives us another reason - Gann, squaring of price and time - to consider this level technically significant. Indeed you can see that the market appears, at this time, to have reacted to this level. It did “spike” through it, however it also looks to have found support, as the pullback/shape of the candlestick indicates.
As mentioned, numerous factors influence the EURO/JPY at this time. Events in Europe, the unwinding carry-trade, and also Commodities, are all reflected in to the pricing of the EURO/JPY. We showed that this in turn impacts the $USD, which influences the $SPX.
Let’s consider then, a chart of the EURO/JPY and the $SPX.
Again, the scales are not the same, however the dates are in line, and we can see the direct relationship between the EURO/JPY and the $SPX. Keeping an eye then, on the technical indications from the EURO/JPY would be important. While we could draw on numerous significant technical studies on the $SPX (channels, retracements etc.) unless we see the EURO/JPY having technical levels of its own, that line up with the $SPX levels, the technical analysis you have done on the $SPX alone will not hold or give a reaction as expected. At this point in time, the $SPX is really reacting to technical indications from the EURO/JPY.
We will have to see in the coming week how the EURO/JPY reacts to our current technical level. There is reason to expect a pullback or bounce at this point (technically) and if it does occur, we should also see a reversal in the $SPX market as well.
Also on the chart is a bottom channel that runs just under our current EURO/JPY level. This would be the next likely place to expect a bounce or pullback, should our current levels break.
Should the current levels on the EURO/JPY break, then we could also expect to see more down in the $SPX market.
The 800 Pound Gorilla
The bond market is the 800 pound gorilla compared to the equity markets and when it breaks 120 year yield levels it must be considered. Overlaying the technical developments in this market rounds out our three point approach.
The cornerstone of our debt crisis is the yields and spreads on the debt. This gets very complex when you start considering global currency adjustments, however sometimes the right perspective is all that is required.
As was stated at the start, knowing the technical triggers from various markets can help determine when the market you are trading will react. If you study several markets, and not just your own, you quickly notice that many will come to technical “ heads” at the same time, giving you some indication to pay attention.
When you understand what market(s) directly affect the one you are trading, you can again increase your knowledge and overall confidence as a trader and smart investor.
Uninformed and nervous investors make bad decisions.
Gordon T Long & GoldenPhi
Download your FREE copy of the latest TRIGGER$
Gordon T. Long
Market Research & Analytics
www.gordontlong.com
GoldenPhi
TRIGGER$: Economic & Technical Analysis for the Active Trader
www.triggers.ca
© 2012 Copyright Gordon T. Long - All Rights Reserved Disclaimer: The above is a matter of opinion provided for general information purposes only and is not intended as investment advice. Information and analysis above are derived from sources and utilising methods believed to be reliable, but we cannot accept responsibility for any losses you may incur as a result of this analysis. Individuals should consult with their personal financial advisors.
© 2005-2022 http://www.MarketOracle.co.uk - The Market Oracle is a FREE Daily Financial Markets Analysis & Forecasting online publication.