


Gold and Commodities Major Long-term Bottom Forming
Commodities / Commodities Trading Jun 05, 2012 - 04:16 AM GMTBy: Toby_Connor

 Stocks:
With Friday's employment report a few things began to clear up. The first one is the correct cycle count on the stock market. With the break to new lows it's now apparent that April 10th formed either a very stretched, or very short daily cycle. I tend to lean towards the very short cycle interpretation based on the trend line breaks I have illustrated in the chart below.
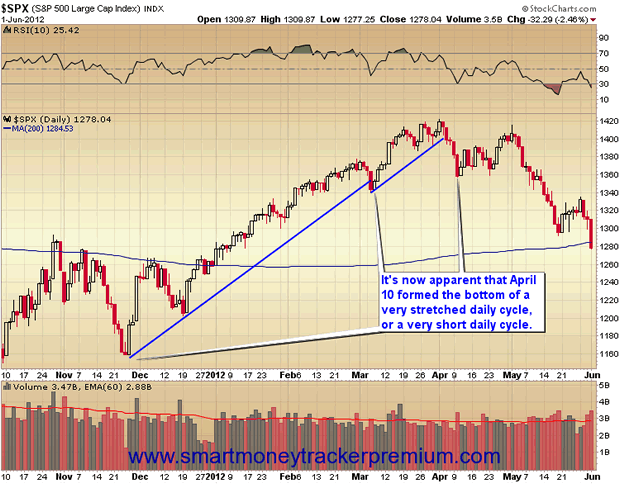
But one could make the case for one very long, extremely stretched daily cycle driven by LTRO and operation twist. No matter how you interpret the last two daily cycles it's now apparent with the break to new lows that April 10th did in fact form a daily cycle bottom. That puts the current daily cycle on day 37 and now deep in the timing band for a daily (30-40 days) and intermediate (20-25 weeks) degree low. As the intermediate cycle is now on week 34 it's apparent just how far LTRO and Operation Twist stretched the stock market cycle.
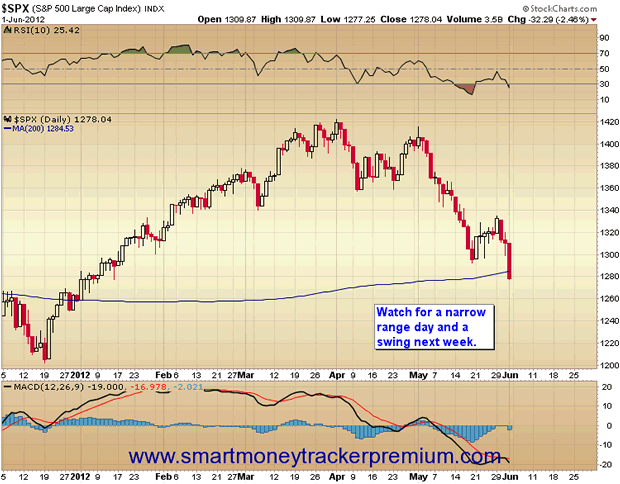
I suspect sometime next week we are going to see a narrow range day and a large buying on weakness data print on the SPY ETF. Then once a swing forms it should mark the bottom of this intermediate cycle.
I have mentioned before how news mysteriously seems to coalesce around intermediate turning points. I suspect this time it's going to be another round of quantitative easing by the Fed (although it won't be called QE) or a gigantic LTRO in Europe to bail out Spain and Italy, or a combination of both. Either way it's now late enough in this daily cycle that we should expect a bottom very soon (probably early next week). The fact that this intermediate cycle has stretched extremely long raises the odds massively that the next daily cycle bottom is also going to be an intermediate and yearly cycle bottom.
Once we have printed the intermediate low we should see stocks rally back to at least test the highs ($1422). If the market becomes convinced the next round of money printing is on the way then this could be an explosive rally as traders have now been conditioned to expect QE to drive big market rallies.
In the chart below, the first scenario is the most likely in my opinion and would be what I would expect to happen if more QE is introduced.
The second scenario would play out if inflation surges high enough and quickly enough to topple the already weak global economy. In that scenario the stock market would move to marginal new highs, allowing smart money to offload positions to dumb money buying into the breakout. What would follow would almost certainly be a 1 1/2 to 2 1/2 year grinding bear market as the slowly deteriorating fundamentals fight ever larger infusions of liquidity from global central banks. Unfortunately liquidity is exactly what would be driving commodity inflation so central banks would actually be making the problem worse rather than better.
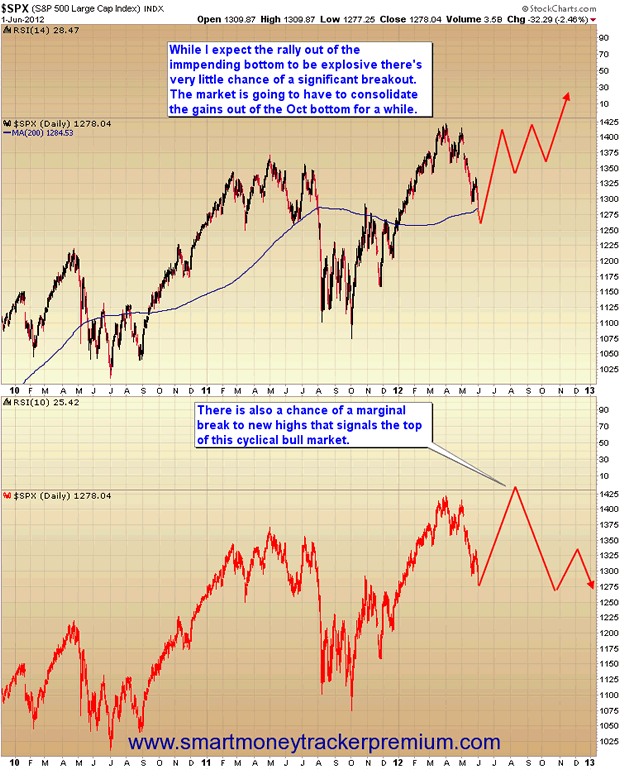
That being said stocks, especially tech stocks led the last intermediate cycle. I doubt hot money is going to jump back into that sector again right off the bat. No, I expect the stock market will rally fairly quickly back to the old highs but then run into a brick wall that will require considerable consolidation before any serious breakout.
This intermediate rally is almost certainly going to be led by a different sector. As a matter of fact the new leaders are already starting to show their true colors. (More on that in the gold section of today's report).
Dollar:
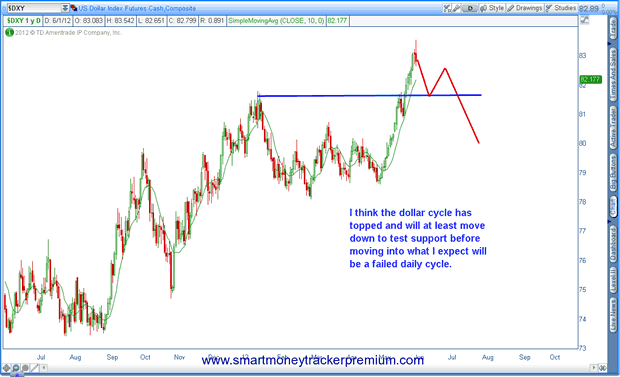
An intermediate bottom in stocks (and commodities) should also correspond with an intermediate top in the dollar. I suspect the reversal on Friday's employment report is going to mark not only a daily cycle top, but probably an intermediate, and possibly even a three year cycle top on the dollar index.
I say this because the CRB is now due to form a major three year cycle low, and I don't see that cycle low forming until the dollar index has topped. Since this three year cycle has already stretched slightly long it's unlikely to stretch for another complete intermediate cycle. All that means is that the CRB's three year cycle should bottom along with the yearly cycle in stocks and gold (which already bottomed slightly early two weeks ago).
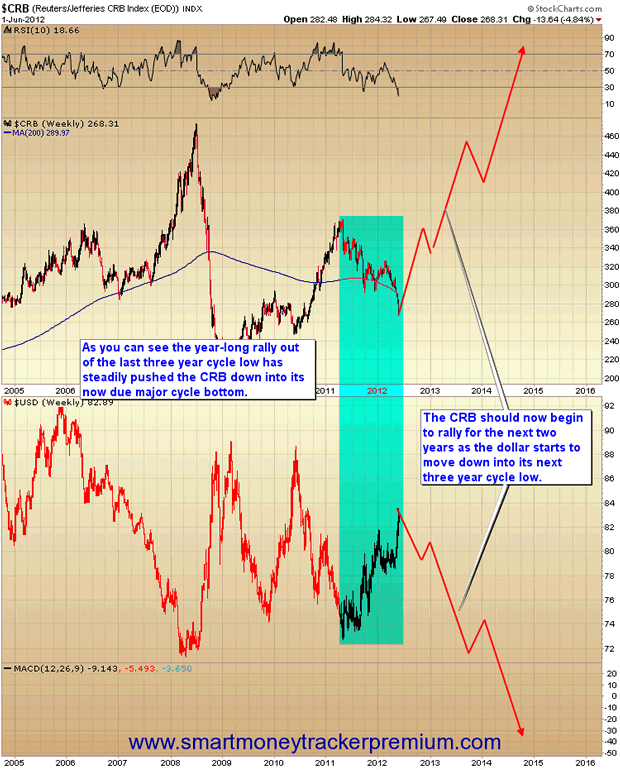
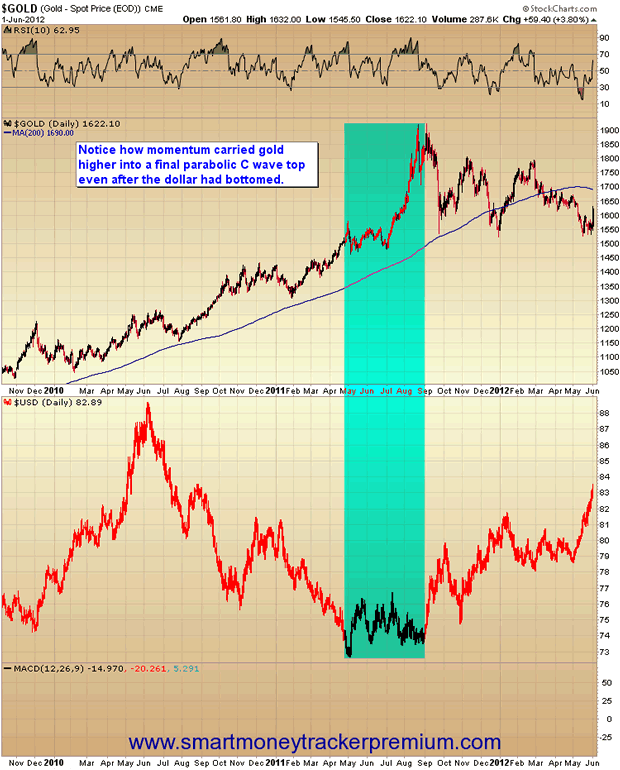
Once the dollar has topped the CRB will stop falling and begin moving back up, into what I think will be a parabolic spike much bigger than what occurred in 2008. That parabolic top should come sometime in late 2014 as the dollar moves down into its next three year cycle low. Or as was the case with gold in 2011 momentum may carry the parabolic move slightly past the dollar's bottom.
Since the CRB's three year cycle is already starting to stretch slightly long I am confident that bottom is going to occur right now as gold and stocks all put in their yearly cycle lows. As long as the CRB, gold, and stocks don't stretch their yearly cycles any further, and I don't see why they should, then the dollar's rally out of the three year cycle low is on its last legs.
As I mentioned last week sentiment in the dollar index has reached levels not seen in the last 12 years. This is exactly what one would expect to see at a major three year cycle top.
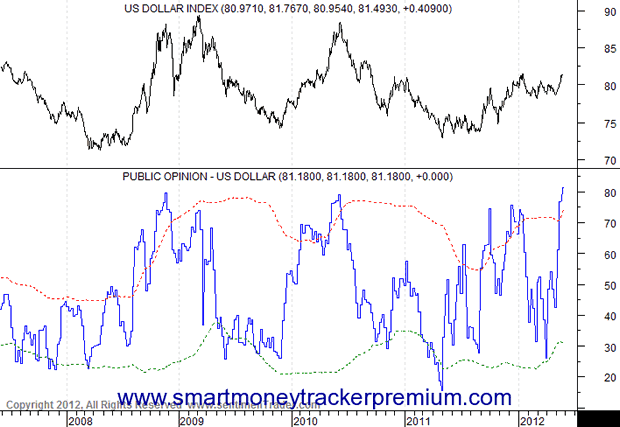
Chart courtesy of sentimentrader.com
So conditions are now in place for major reversals in stocks, commodities, precious metals (already bottomed), and the dollar.
Gold:
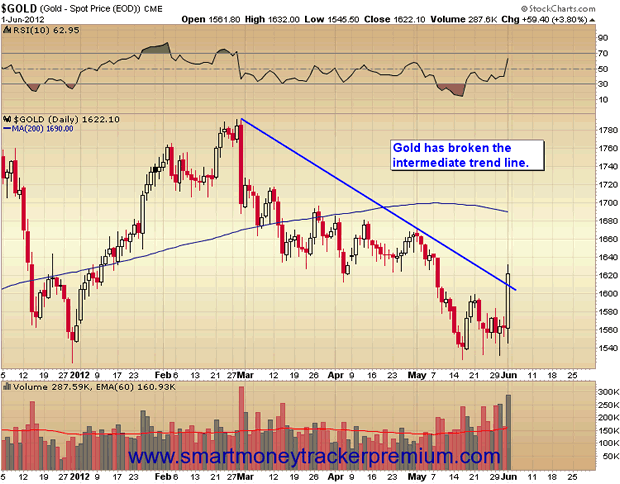
I think it's safe to say that Friday's action took the short cycle scenario off the table (as well as the D-Wave continuation). Gold not only broke its intermediate trend line, but also formed a weekly swing. I think we have all the confirmation we need at this point to conclude that gold's intermediate cycle bottomed two weeks ago. (My previous post dated May 17 correctly called gold's bottom within a single day).
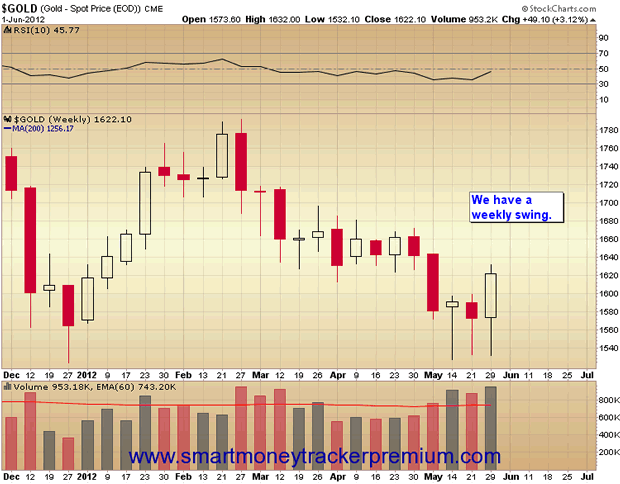
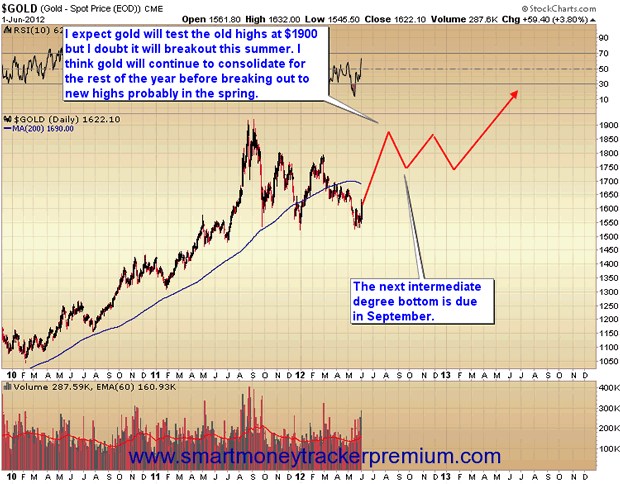
As I pointed out in the dollar section above, this should also mark a yearly cycle low and a B-wave bottom in the gold market. I'm about 99% positive Friday's rally was the kickoff of a brand new C-Wave advance. That being said I wouldn't expect gold to rally straight up to new highs this summer. It may test $1900 during this new intermediate cycle but I think gold is still going to have to consolidate for most of this year before it can breakout to new highs. My best guess is probably next spring before any sustained move above $1900.
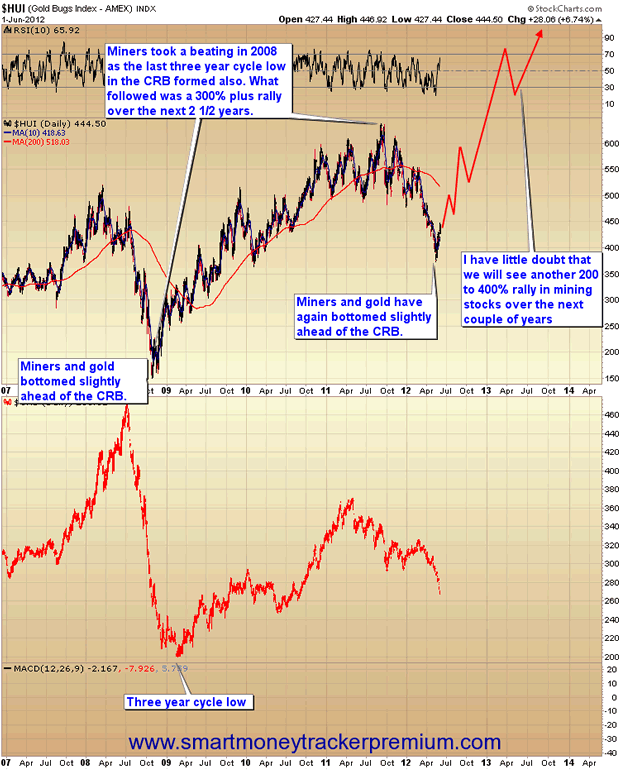
This means I think the bear market in miners has probably ended. As everything starts to rally out of its yearly cycle low (and the CRB out of its three year cycle low) the biggest gains are going to be made in the sectors hardest hit during this correction. Without a doubt that was mining stocks. At the lows two weeks ago miners had reached levels of undervaluation only seen one other time in history. That was at gold's eight year cycle low in the fall of 2008.
As you can see in the chart below miners rallied over 300% as everything came out of that major bottom in late 2008 and early 2009. I have little doubt we will see something similar this time as the CRB begins moving up out of its three year cycle low and gold begins its next C-Wave advance. Hot money is going to start looking for sectors with the potential for big percentage gains. No sector has that kind of potential more than the mining stocks. As a matter of fact I expect the gains in this sector to be absolutely mind blowing over the next 2 1/2 years.
For our purposes all we need to know right now is that gold is on week two of a brand-new intermediate cycle. In these two weeks the HUI has already rallied almost 19% from the trough to yesterday's close. Keep in mind this occurred while the stock market was still going down and gold was moving sideways. The out performance in mining stocks is a subtle hint for anyone that cares to take notice of what is going to lead the market out of this major bottom. It's the same hint that was given in late 2008 right before miners launched into a 300% rally.
$10 one week trial to the premium newsletter.
Toby Connor
Gold Scents
GoldScents is a financial blog focused on the analysis of the stock market and the secular gold bull market. Subscriptions to the premium service includes a daily and weekend market update emailed to subscribers. If you would like to be added to the email list that receives notice of new posts to GoldScents, or have questions,email Toby.
© 2012 Copyright Toby Connor - All Rights Reserved
Disclaimer: The above is a matter of opinion provided for general information purposes only and is not intended as investment advice. Information and analysis above are derived from sources and utilising methods believed to be reliable, but we cannot accept responsibility for any losses you may incur as a result of this analysis. Individuals should consult with their personal financial advisors.
© 2005-2022 http://www.MarketOracle.co.uk - The Market Oracle is a FREE Daily Financial Markets Analysis & Forecasting online publication.