Greece Election Eurogeddon Stock Market Trend Analysis and Forecast
Stock-Markets / Stock Markets 2012 Jun 16, 2012 - 12:34 PM GMTBy: Nadeem_Walayat
 The world watches as Greek politicians build themselves up into a frenzy ahead of Sunday's election, uttering contradictory statements with virtually every breath. For instance Tsipras of Syriza promises end to economic austerity AND that Greece will stay within the euro-zone. Meanwhile the leader of New Democracy warns that this could be Greece's last election!
However the problem the euro-zone faces is not really about the Greek economy going bust, instead it has always been about the contagion consequences for the rest of the Euro-zone that Greece risks triggering, all the way from tiny Cyprus to the giants of Italy and even France. A Greece exit would change the dynamics of the single currency by setting a precedent that virtually guarantees that the Euro-zone currency would fall apart as each country is targeted one after another for the fundamental reason that without competitive devaluations between countries they are destined to go bankrupt as they cannot compete against Germany.
For this we are seeing signs in the credit markets response to the Euro 100 billion Spanish bank bailout by pushing up the Spain's borrowing costs to Euro-zone record highs of over 7% from 6.5% pre-bailout because the market realised that all it will do is to pile more debt onto the backs of Spanish tax payers as well as increasing the actual risk of default because the Euro 100 billion will have no positive economic consequences for Spain, but is purely to delay Spain's ever expanding debt mountain from toppling over i.e. keep Spanish banks liquid whilst insolvent.
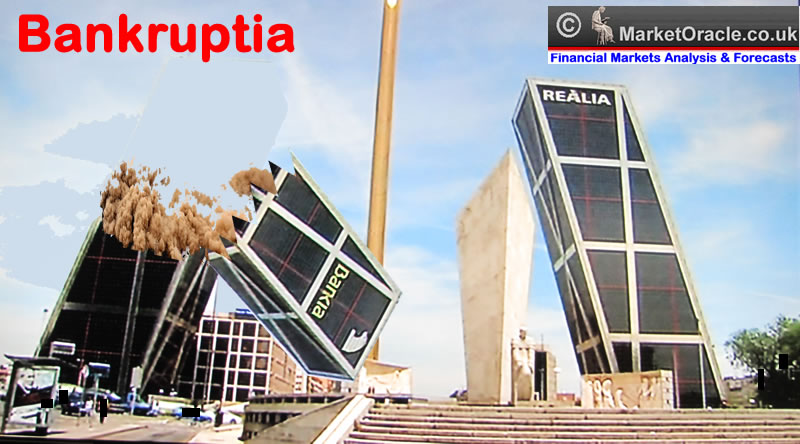
The bottom line remains, regardless of whatever the politicians state Spain and Portugal WILL leave the euro-zone within 6 months of Greece leaving because of the fundamental flaw in the euro-zone where countries are unable to competitively devalue against one another which ensures ever increasing perpetual austerity.
Central Banks Response to Greece Eurogeddon
All week we have seen emerging signs and announcements that Central banks are preparing the way for a wall of electronically money printing in an attempt to drown out the eurogeddon firestorm with ever expanding waves of liquidity, such as UK measures announced on Friday that the Bank of England will give cheap money to the banks to enable them to provide credit to the wider economy. Off course the reason offered is just smoke and mirrors propaganda, the real reason is for the Bank of England to yet again stuff every orifice of the UK banks with tax payer cash (where ultimate liability lies) ahead Eurogeddon Monday following outcome of Sundays Greek election.
This £140 billion of liquidity for the banks will soon mushroom ever higher to whatever is required to prevent a run on the banks, so I could pluck a figure out the air such as £300 billion as the Eurogeddon cost to the UK for once the dust has settled.
Eurogeddon Good News for the Markets?
Whilst the mainstream press is fully focused ont he potential dire consequences of Grexit following the Sunday Greek elections. However, as I wrote on the 4th of June at length that eurogeddon would be good news for markets where many of the adverse market trends that had been in force for several months were expected to start to reverse ahead of the dissipation of uncertainty which the Greek elections are a clear marker of.
Whilst the lead up to Financial Armageddon is resulting in much pain for investors and traders alike. However, my expectation's are for the majority of observed trends to start reversing as the Financial Armageddon uncertainty starts to dissipate, so in a way Financial Armageddon would be GOOD for the markets because markets DISCOUNT THE FUTURE (and the future is INFLATIONARY), and the problem we have in the lead up to the present is that the future has INCREASINGLY been UNCERTAIN. In such a climate of increasing uncertainty, markets increasingly discount even greater FUTURE UNCERTAINTIES in a sort of feed back loop, and hence you have what we have seen in the stock and commodity markets, coupled with the flight of funds into bankrupt money printing nation bonds such as the USA and UK.
Therefore No matter what the actual outcome is, and how bad the mainstream press will paint it as, as a total disaster, know this that once future uncertainty starts to dissipate then we will tend to see a reversal in the majority of the trends that have been in force for the past few months, i.e. markets such as stocks, commodities and Euro should rally and markets such as US and UK, bonds, dollar and sterling fall.
Now some 12 days on market trend reversals have started to manifest themselves from the stocks, commodities and even all the way to the forex markets where there are clear technical signs of a reversal in the works for the Euro against the Dollar. Off course eurogeddon by it's nature will induce market volatility. The big question mark is at what point will the markets react to DISCOUNT future Central bank money printing actions that will inflate asset prices such as the Bank of England's announcement Friday, so ironically eurogeddon may either only see a very brief negative market reaction or even that the market on Monday moves higher from the outset, which will surely catch many traders exposed to overwhelming doom and gloom off guard.
For more in depth analysis of Euro-zone Financial Armageddon and see the following recent articles:
- 04 Jun 2012 - The Pain in Spain Flashes Financial Armageddon, Inflation Wars
- 04 Jun 2012 - Euro-zone Galloping Towards Financial Armageddon, Greece Will Take Third World Europe to Inflation Hell!
- 12 May 2012 - Greece Exit, Euro-Zone Collapse, Spain and Portugal Will Follow Within 6 Months
- 08 May 2012 - France and Greece Voters Reject Austerity for Money Printing Inflation Stealth Debt Default
Fundamental Inflationary Background
The fundamental background is that of the world markets about to be exposed to another wave of highly inflationary central bank money printing liquidity. I have covered at length over the past few years to explain why deflationists are wrong in their mantra of debt deleveraging deflation that only really exists in their theoretical models, despite REAL and ongoing inflation, the usual suspects from the mainstream press right through to the BlogosFear still continue pounding away at the non existant Deflation argument, despite the fact that even countries such as Greece that have been in economic meltdown have suffered INFLATION (Greece 10% Inflation over the past 3 years).
Pause there for a moment and think about that. Greece has had 10% INFLATION Whilst its economy has collapsed by more than 16%, whilst average workers wages have collapsed by more than 20%. Greece illustrates the difference between the REAL world and THEORY!
I have explained this countless times that the destruction of Supply is greater than the destruction of demand because people who lose their jobs do not stop consuming, and this consumption is financed via debt, deficits and sale of assets which is why Greece has Inflation which is why There Won't be DEFLATION.
Deflationists Really Are Fools
Bluntly, they just don't get! This is the problem when people follow academia, follow theory of what should happen, for academics are good at only one thing which is to write reams and reams of text that drowns out market logic.
Deflationists such as Krugman and his disciples bang on and on about deflation, about destruction of demand, that will result in deflation, about debt deleveraging that will result in deflation. What the deflation fools remain blind to is the fact that the central banks such as the Fed, and the Bank of England have been stuffing every orifice of the deleveraging banks with free money which results in artificial profits as the banks risks / debts are being systematically transferred to the central banks balance sheets. Which is WHY FALLING DEMAND and FALLING WAGES are NOT resulting in Deflation! because in totality, there HAS BEEN NO DEBT DELEVERAGING, TOTAL DEBT IN FACT CONTINUES TO EXPAND as central banks MONETIZE GOVERNMENT DEBT and in some cases EXPOENENTIALLY. And not only that but money printing AKA QE is far worse for an economy than Debt money (bank created credit) because it REALLY has just been conjured out of thin air with no economic activity to justify its creation.
This is why asset prices WILL rise, ALL prices including assets because of central bank QE which should not just be seen as free money for the banks but direct deliberate debasement of the currency. Unlike bank credit It WILL NEVER be destroyed instead feeds the Inflation Mega-trend which I termed in March 2009 as QE really being Quantitative Inflation.
I know this may be getting rather complicated, so if you want to understand only one thing, know this that money printing by central banks is highly inflationary, highly corrosive to the purchasing power of a currency, which is why despite all of the academic reasons why we 'should' have deflation in reality we have INFLATION.
So I will leave the deflation fools to keep crying Deflation all the way to HYPERINFLATION, and even then they will say they were right because AFTER deflation supposedly comes Hyperinflation, despite the fact there never was ANY Deflation, not even for bankrupt Greece.

So fundamentally we remain immersed in an EXPONENTIAL INFLATION MEGA-TREND. Maybe some day the highly vocal deflationistas' such as Mish will be ready to take the red pill, but for now they continue to exist in an imaginary deflationary world that is blind to the severe consequences of central bank money printing.
It's not demand that's being destroyed its the currency! Which is why consumer and asset prices rise because central banks cannot print the likes of gold, and consumer goods, but instead print the money to finance government debt and deficits.
Stock Market 2012 First Half Strategy
As regularly indicated since Mid December 2011, in view of expectations for a tough year for a maturing stocks bull market during 2012, my strategy for the first half of 2012 had been to cut my net long exposure to the stock market from about 40% of assets (Dec 18th) by selling into a rally into late April / Early May 2012 as indicated by my last stocks analysis and forecast of Feb 2012, which has resulted in cutting my exposure to the stock market to about 8% as of last my in-depth analysis of a couple of weeks ago.
Stocks Stealth Overall Bull Market Investing Strategy
The over-riding bull market strategy since the birth of the bull market in March 2009 has been pretty simple, which is that the greater the deviation from the preceding High then the greater the buying opportunity it presents, as the bull market should ultimately resolve to new highs.
Therefore the primary purpose of this analysis is to determine if the recent sell off and subsequent rally is likely to target a trend to new bull market highs over the next month or so.
Market Sentiment - Market sentiment is usually in synch with the mainstream media, which at this point in time should suggest that it is at its most bearish in the face of an imminent eurogeddon event.
However the short-term rally that has taken place over the past 2 weeks is contrary to the mainstream media noise, on face value this either implies that the market is discounting resolution of uncertainty or that the market is buying to sell on the news.
In terms forecasting trend, it would have been much better for the market to be falling going into the Greece election as that would better sow the seeds for a stronger market reversal. Having a Dow 700 point rally going into eurogeddon actually weakens the markets short-term prospects.
Stock Market Volatility - VIX
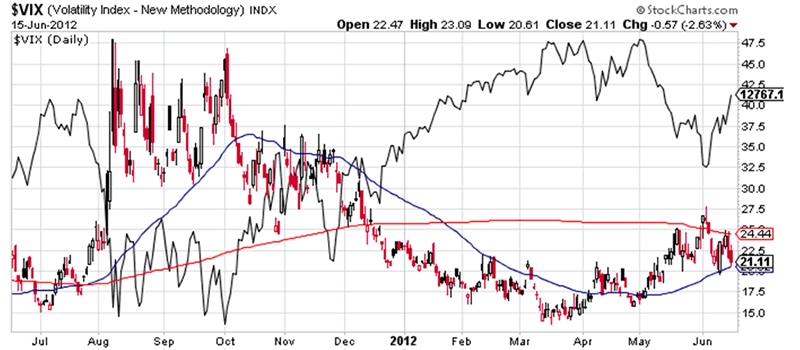
The fear in the media is not being matched by fear in the stock market. The VIX is not indicating much panic or fear in the market. It's actual rising trend is pretty moderate given that we stand on the eve of eurogeddon. This is not the pattern I would expect in advance of a market getting ready for a big move higher. In fact given that the VIX is trending higher, to me the VIX is suggesting that a FALL in the stock market is more probable than a rise.
Stock Market Trend Shows Weakness Against Forecast
My last forecast for the stock market of 21st Feb 2012, expected stocks to correct into early March before rallying to a new bull market high by late April / Early May ahead of a significant correction in May as indicated by the original forecast graph below:
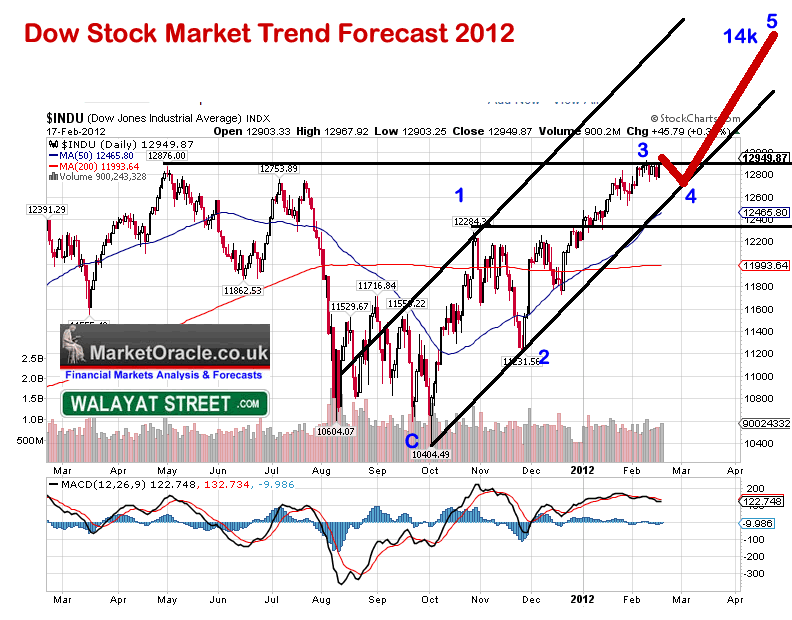
Whilst the overall trend trajectory was inline with expectation's in offering significant rallies to sell into following an early March low and a late April / Early May high ahead of a significant May correction. However as the below Dow chart indicates, the stock market showed significant weakness against the forecast high of Dow 14k, which warned of even weaker price action than expected for May.
Whilst the big picture is that of a continuing trend higher to Dow 14k at which point the Dow can be expected to experience significant resistance as it approaches a new all time high the subsequent trend for which will become much clearer by that time but which currently implies a significant correction is likely during May which matches both the seasonal tendency (sell in may and go away) as well as likely approaching the finale to the Greek Tragedy (markets act before the event) namely exit from the euro-zone and a deepening Euro-zone recession. This supports the very long-term technical analysis which currently implies it will take some time for the Dow to break and hold to a new all time high.
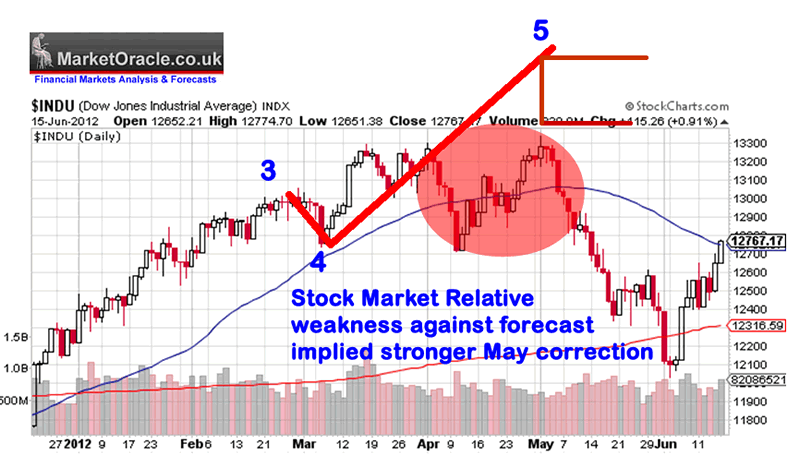
Therefore the subsequent May sell off has been far more severe which included the important break of the Wave 4 low, the implications of which I will cover next.
Elliott Wave Theory - The EW count has remained remarkably stable and continues to play out pretty much as expected as of December 2011 for a 5th wave to terminate in late April / Early May and followed by a strong correction back towards Dow 12k as stated in Feb 2012.
The EW picture continues to play out as of last analysis of 18th Dec 2012 with the current Wave being a Wave 3, that is likely to imminently resolve in a Wave 4 correction that implies it will be followed by an Impulse Wave 5 that could carry the Dow to 14k. This suggests a short-lived correction, to be followed by a trend higher into late April / early May. This also implies that when the 5th wave terminates something far nastier is in store for the stock market which at this point implies an ABC correction back down towards Dow 12k.
Key Points
1. The fifth wave peak as mentioned earlier was far weaker than expected.
2. The subsequent May correction whilst fulfilling my target of Dow 12k, however does not match that for an corrective ABC pattern but appears Impulse in nature. This suggests to me that we are in a larger ABC corrective pattern which implies that the current rally is corrective and likely to resolve in the Dow revisiting the 12k level.
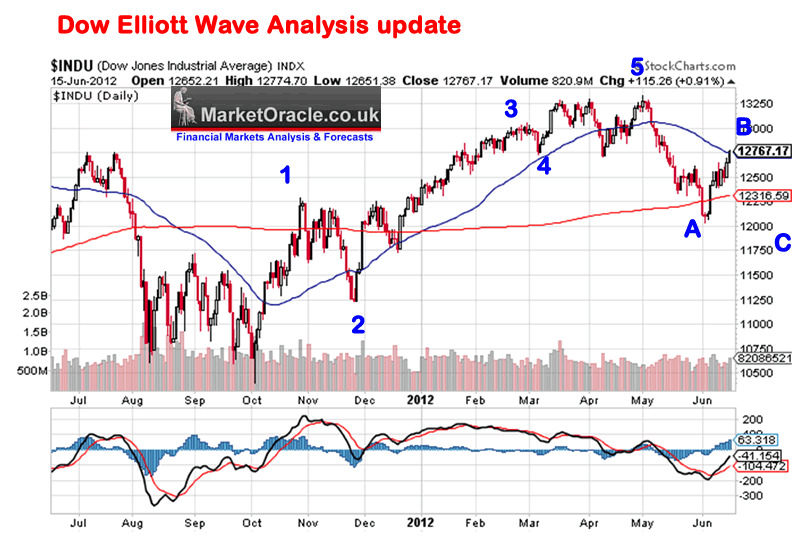
The bottom line is that this analysis confirms what I suspected back in February 2012 that the early may peak would resolve in a move that would seek to correct the whole rally from October 2011, which requires a significant overall downtrend both in terms of time and price. The subsequent weakness in the Wave 5 peak suggests that a break below Dow 12k is probable.
MACD - The MACD is looking pretty positive for the stock market, having turned higher from an oversold level, suggests that the stock market should be supported going forward.
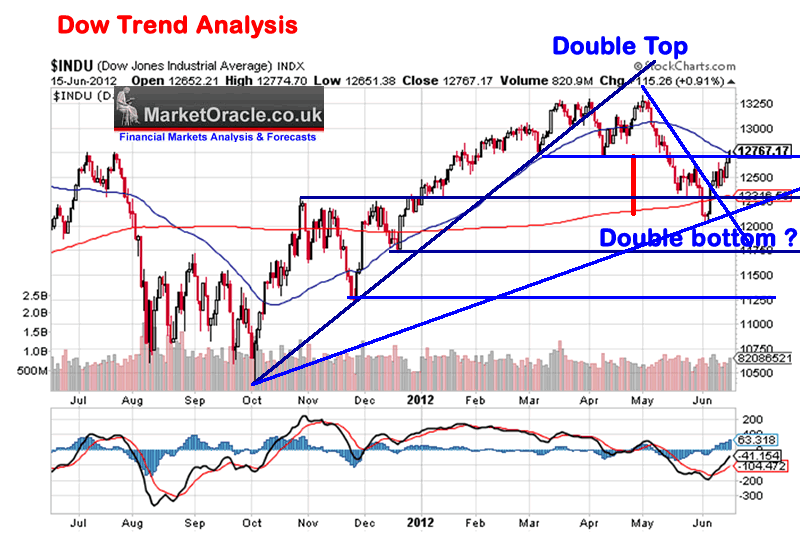
Price Patterns - The double top price pattern measures to 12,000. Which implies that either the low is in, or that any further downside is very limited, which raises the possibility that another bout of selling may result in a double bottom.
Trend Analysis - The current rally has cleared the down trendline off of the last high which is positive. In terms of trendline support lies at a fairly distant 12,250 which therefore puts a significant buffer under the stock. The Dow is at significant resistance area coinciding with previous lows around 12,750. The next resistance lies at 13,250. Whilst support lies at 12,300 and 12000, then 11,700. So basically the Dow is currently near the middle of a trading range of between 13,250 and 12,000. Given that the current trend is a reversal rally which suggests a test of the low is probable.
Stock Market Trend Forecast Conclusion
This analysis is resolving towards a picture that is not as bullish as I thought it would be given that we have already had a correction, and are in a rally going into eurogeddon. However nor is it as dire as it could also have been.
The key point is that the long waited for Greek Tragedy has finally arrived which will result in much dissipation of uncertainty as I wrote in Feb 2012 -
A significant correction is likely during May which matches both the seasonal tendency (sell in may and go away) as well as likely approaching the finale to the Greek Tragedy (markets act before the event) namely exit from the euro-zone and a deepening Euro-zone recession. This supports the very long-term technical analysis which currently implies it will take some time for the Dow to break and hold to a new all time high.
The big picture remains exactly as above in that it will take the Dow some time to break and hold onto new all time highs.
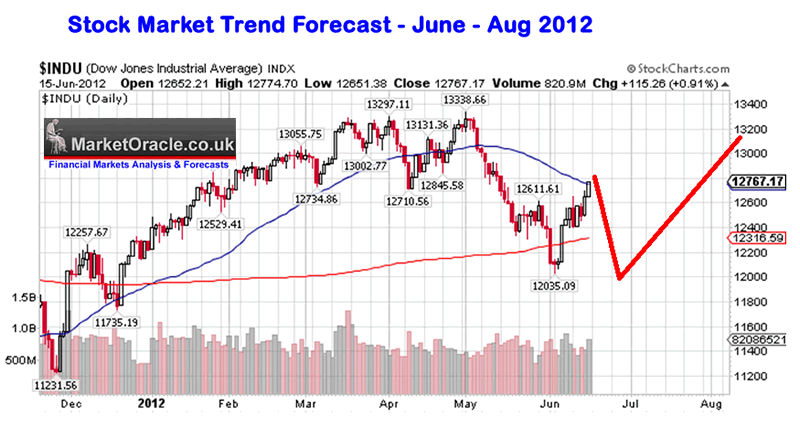
In terms of a forecast trend, this analysis resolves towards an imminent trend to test and possible break of the recent low of 12,035. How far will the break go ? It could trade all the way down to 11,700, but given that the Dow put in a double top, probability favours a double bottom. The bottom it puts in should be firm enough to propel the Dow towards the upper end of the range as the below trend forecast graph concludes:
My strategy - I see a couple of range trading opportunities over the next month or so. However, I am not seeing any real reason to start accumulating much stock in terms of long term investments, perhaps lift my holding to 10% of assets (net long) on the next sell off, because there is no clear evidence that the stock market looks set to break out of this trading range so it's not appealing in terms of risk vs reward. I will wait to see whether the stock market shows relative strength or weakness against this forecast trend. A stronger market will encourage me to accumulate.
Your analyst who will probably regret not waiting until AFTER Drachmageddon before doing this analysis and forecast.
Source and Comments: http://www.marketoracle.co.uk/Article35176.html
By Nadeem Walayat
Copyright © 2005-2012 Marketoracle.co.uk (Market Oracle Ltd). All rights reserved.
Nadeem Walayat has over 25 years experience of trading derivatives, portfolio management and analysing the financial markets, including one of few who both anticipated and Beat the 1987 Crash. Nadeem's forward looking analysis focuses on UK inflation, economy, interest rates and housing market. He is the author of three ebook's - The Inflation Mega-Trend; The Interest Rate Mega-Trend and The Stocks Stealth Bull Market Update 2011 that can be downloaded for Free.
Nadeem is the Editor of The Market Oracle, a FREE Daily Financial Markets Analysis & Forecasting online publication that presents in-depth analysis from over 600 experienced analysts on a range of views of the probable direction of the financial markets, thus enabling our readers to arrive at an informed opinion on future market direction. http://www.marketoracle.co.uk
Disclaimer: The above is a matter of opinion provided for general information purposes only and is not intended as investment advice. Information and analysis above are derived from sources and utilising methods believed to be reliable, but we cannot accept responsibility for any trading losses you may incur as a result of this analysis. Individuals should consult with their personal financial advisors before engaging in any trading activities.
Nadeem Walayat Archive |
© 2005-2022 http://www.MarketOracle.co.uk - The Market Oracle is a FREE Daily Financial Markets Analysis & Forecasting online publication.


