


U.S. Stock Market Uptrend Appears Underway
Stock-Markets / Stock Markets 2012 Jun 18, 2012 - 01:35 AM GMTBy: Tony_Caldaro

 After last week’s market surge, (+3.65%), the market started the week with a gap up. But it was sold off and the market remained quite choppy until early thursday. Then the rally resumed. For the week the SPX/DOW were +1.5%, and the NDX/NAZ were +0.5%. Growth stocks appear to be lagging, somewhat, as the 2 year tech cycle low approaches. Asian markets gained 1.4%, European markets rose 1.2%, and the DJ World index rose 1.6%. Economic reports for the week were heavily biased to the downside: 2 up and 12 down. On the uptick: business inventories and the monetary base. On the downtick: export/import prices, retail sales, the CPI/PPI, the NY FED, industrial production, consumer sentiment, and the WLEI. Also, the budget deficit, current account deficit, and weekly jobless claims all rose. Overall, it was a good week for stocks as the economy continues to weaken. FOMC meeting concludes this wednesday.
LONG TERM: bull market
Our indicators, and the market’s wave structure continue to support an ongoing bull market in the US. After a complete review of the foreign indices this week, we still have England and Switzerland in bull markets as well. The other seventeen indices, including the DJ World index, all appear to be in bear markets. These three bullish indices have something in common. They all have their own currencies, are able to expand their monetary base when needed, and the current impact of the inflationary consequences of massive liquidity is minimum.
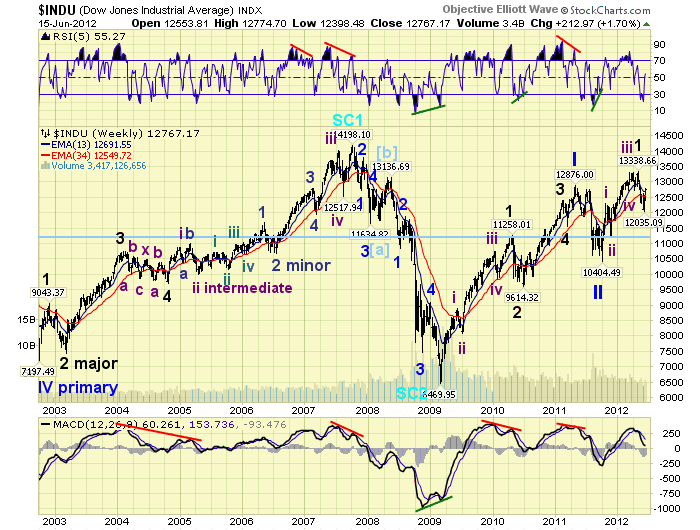
Our preferred count continues to be displayed on the DOW charts. A bear market low in March 2009. Then the beginning of a five Primary wave, Cycle wave [1], bull market. Primary waves I and II ended in April 2011 and October 2011 respectively. Primary wave III has been underway since then. It is also interesting to observe: of the five Major waves in Primary I, only Major wave 1 subdivided into five Intermediate waves. Notice how Major wave 1 of Primary III has also subdivided into five Intermediate waves. Fractals, harmonics, whatever term you prefer to use, the waves of this bull market are unfolding in repetitive and interlocking patterns.
MEDIUM TERM: uptrend may be underway
Typically at the end of a downtrend the market gets quite oversold or displays a positive divergence at the low. We recently had a positive divergence. Then the market rallies to overbought and either stays there, or gets oversold again to complete the first two waves of the uptrend. Should it do the latter another series of overbought and oversold conditions completes waves 3 and 4. Then the next rise to overbought ends the uptrend. Thus far, this first rally has barely reached overbought.
Supporting the potential uptrend scenario is the WROC buy signal we had a week ago. These signals usually occur at the beginning of uptrends, and have been better than 90% reliable since our sample began in 2008. The only two failures, of 27 signals, were fully retraced the following week. That did not occur this week. Also of note, of the nine SPX sectors we track the XLP (consumer staples) has recently joined the XLU (utilities) in a confirmed uptrend. Sector improvement, seven are still in downtrends, usually occurs at the beginning of uptrends as well. As long as the market continues to improve we should get an uptrend confirmation soon.
SHORT TERM
SPX support remains at the 1313 and 1303 pivots, with resistance at the 1363 and 1372 pivots. Short term momentum ended the week quite overbought. The short term OEW charts remain in a positive bias with the swing point now around SPX 1321.
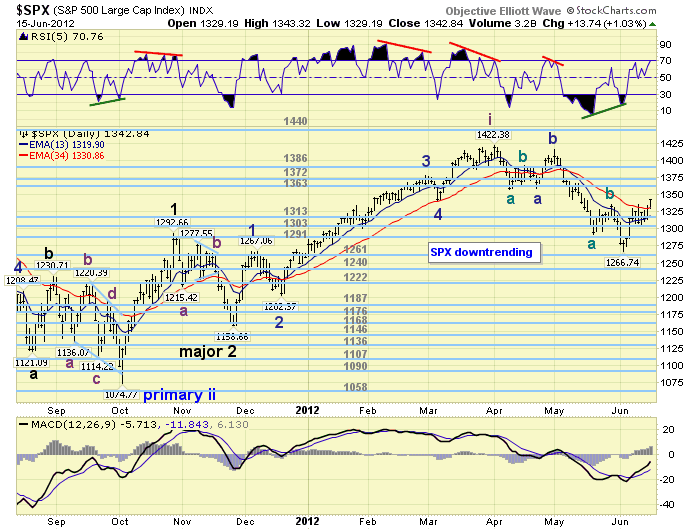
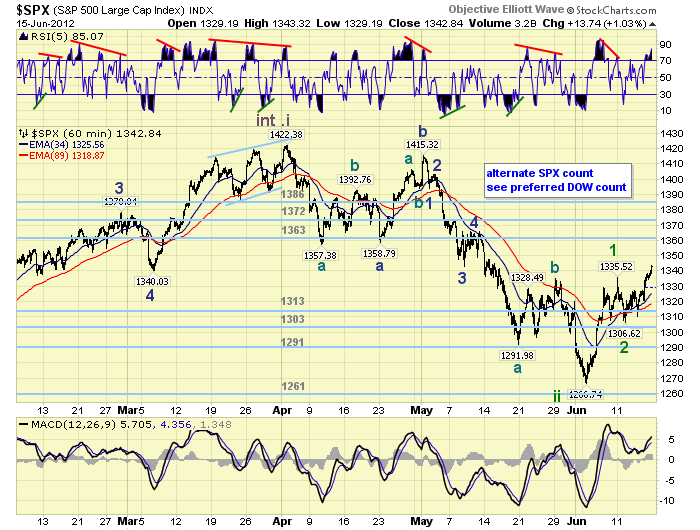
After retracing nearly 61.8% of the uptrend from SPX 1159-1422 the downtrend appears to have bottomed at 1267 on a daily positive divergence. The rally, this week, just passed the first reaction high, SPX 1335, during the downtrend. The next reaction high is at SPX 1366. Coming off the SPX 1267 low. The market had a good rally to SPX 1336, which can be counted as 5 waves up and Minor wave 1. Then a pullback to SPX 1307 for Minor wave 2. The current rally to SPX 1343 should be part of Minor wave 3. This should only be the early stages of an uptrend that could carry the SPX up to the 1499 pivot. Naturally this would take several months to unfold.
Short term support is at SPX 1327/29 and then the 1313 pivot. Short term resistance is at SPX 1342/47 and then the 1363 pivot. The market is quite overbought short term and could have a pullback at any time. After this rally got underway we had noted a break of the OEW 1291 pivot range would be troublesome for the potential uptrend. We then raised that level to the 1303 pivot. We are now raising it again to the OEW 1313 pivot. A break below the 7 point range of the 1313 pivot would likely suggest the potential uptrend has aborted, and the downtrend is resuming. Best to your trading!
FOREIGN MARKETS
The Asian markets were mostly higher on the week gaining 1.4%. No confirmed uptrends yet.
The European markets were also mostly higher gaining 1.2%. No uptrends either.
The Commodity equity group were all higher gaining 2.5% for the week. No confirmed uptrends here as well.
The DJ World index gained 1.6% on the week, and has yet to confirmed an uptrend.
COMMODITIES
Bonds bounced around all week but ended with a 0.1% gain.
Crude also bounced around quite a bit but lost 0.7%. It made a new low for its downtrend at $81.07 on tuesday.
Gold continues to make some upside progress gaining 2.1% on the week.
The USD continues to looked as though it has topped at 83.54. It lost 1.1% on the week.
NEXT WEEK
A somewhat light but important economic schedule for next week. On monday at 10:00 the NAHB housing index. On tuesday we get reports on Housing starts and Building permits. Thursday we have weekly Jobless claims, Existing home sales, the Philly FED, Leading indicators and the FHFA price index. On tuesday FED director Alvarez testifies before Congress. The FED also has its regularly scheduled two day FOMC meeting concluding on wednesday with quite likely a market changing statement. This will definitely be an interesting week. Best to you and yours this weekend and week!
CHARTS: http://stockcharts.com/...
http://caldaroew.spaces.live.com
After about 40 years of investing in the markets one learns that the markets are constantly changing, not only in price, but in what drives the markets. In the 1960s, the Nifty Fifty were the leaders of the stock market. In the 1970s, stock selection using Technical Analysis was important, as the market stayed with a trading range for the entire decade. In the 1980s, the market finally broke out of it doldrums, as the DOW broke through 1100 in 1982, and launched the greatest bull market on record.
Sharing is an important aspect of a life. Over 100 people have joined our group, from all walks of life, covering twenty three countries across the globe. It's been the most fun I have ever had in the market. Sharing uncommon knowledge, with investors. In hope of aiding them in finding their financial independence.
Copyright © 2012 Tony Caldaro - All Rights Reserved Disclaimer: The above is a matter of opinion provided for general information purposes only and is not intended as investment advice. Information and analysis above are derived from sources and utilising methods believed to be reliable, but we cannot accept responsibility for any losses you may incur as a result of this analysis. Individuals should consult with their personal financial advisors.
© 2005-2022 http://www.MarketOracle.co.uk - The Market Oracle is a FREE Daily Financial Markets Analysis & Forecasting online publication.