


Value Line Geometric Index Predicts Major Stock Market Top
Stock-Markets / Stock Markets 2012 Jun 18, 2012 - 02:09 AM GMTBy: Steven_Vincent

 Last week I posted analysis showing that the monthly RSI divergence which formed at the 2011 and 2012 highs is a very reliable indicator of a stock market decline of almost 28% lasting 11 months. I continue to see many, many companion signals which confirm this.
The Value Line Geometric Index is showing a technical condition which has also been a strong indicator of major market tops.
The total number of companies in the Value Line Composite Index hovers near 1675, and is composed of the same companies as The Value Line Investment Survey®, excluding closed-end funds. The Value Line Composite Index has two forms, the Value Line Geometric Composite Index or the Value Line Arithmetic Composite Index...
Exchanges in The Value Line Composite Index are:
■American Stock Exchange
■NASDAQ
■New York Stock Exchange
■Toronto Stock Exchange
The Value Line Geometric Composite Index is the original index released, and launched on June 30, 1961. It is an equally weighted index using a geometric average.[1] Because it is based on a geometric average the daily change is closest to the median stock price change.
The daily price change of the Value Line Geometric Composite Index is found by multiplying the ratio of each stock's closing price to its previous closing price, and raising that result to the reciprocal of the total number of stocks.
Value Line Composite Index
The Value Line Geometric registered a divergence from SPX and INDU at the 2011 and 2012 highs:
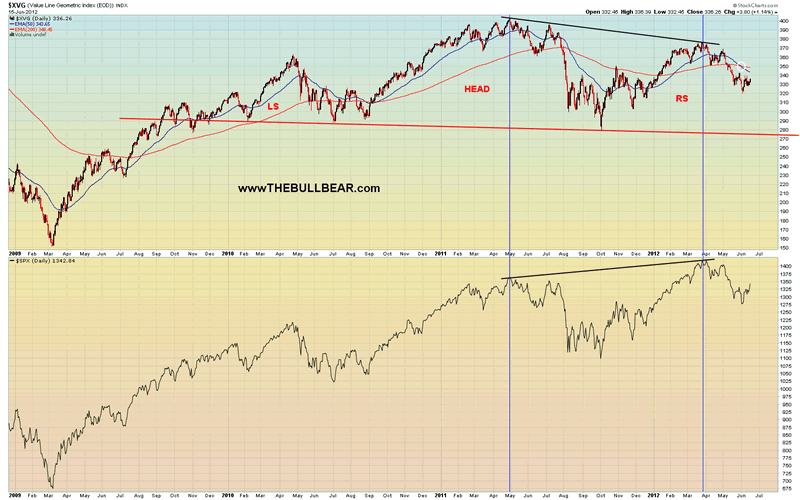
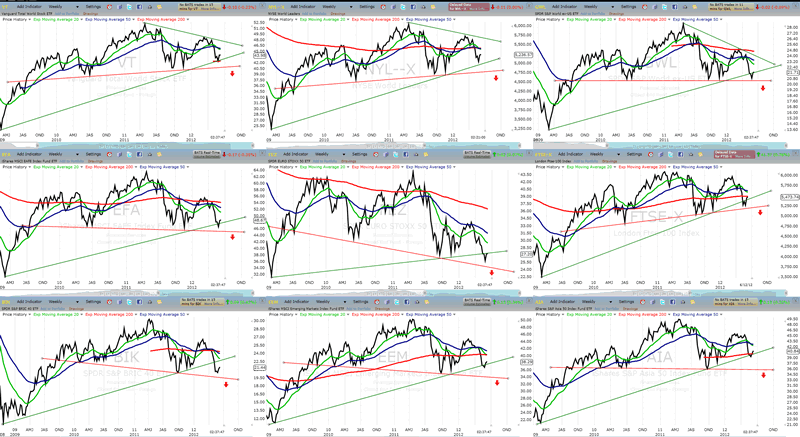
Also note the bear cross of the 50 EMA below the 200 EMA. We can also see a clear multi-year Head and Shoulders topping pattern which has also formed on NYSE and numerous other world stock, commodity and indicator charts:
Have there been other instances of this technical condition heralding a significant bear market?
In 2007, we saw a virtually identical setup:
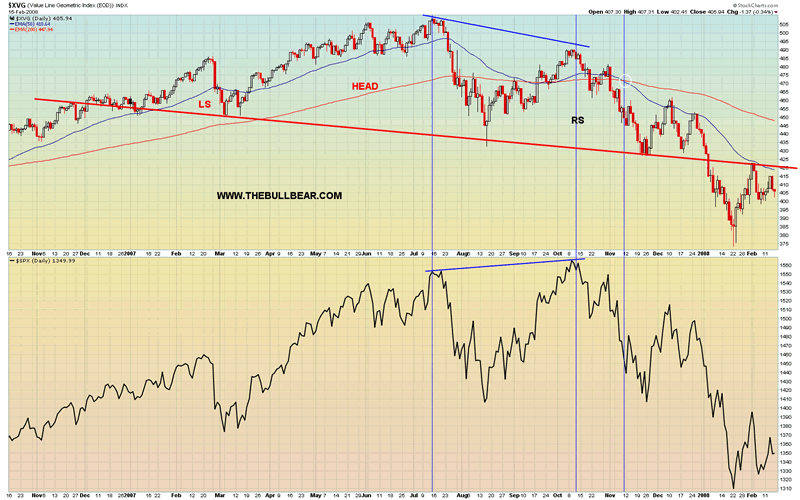
Comparing the two charts you will find remarkable similarities. The moment of the bear EMA cross marks about the halfway point of the right shoulder and also marks a period of a small rally and some volatility.
In the period leading up to and involving the top in 2000, $XVG also diverged from SPX:
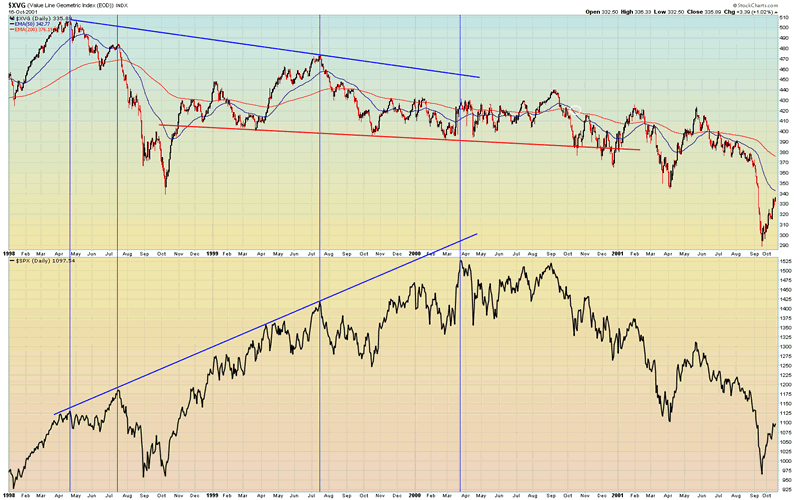
In this case, since the 2000 top was the end to a multi-decade bull market, it took two years for the divergence to play out. There was something roughly akin to a Head and Shoulders formation involved as well.
In all three cases, major divergences and topping patterns formed over an extended period of time and clearly indicated a significant, underlying deterioration of market breadth leading to a major bear market. When taken in conjunction with the plethora of other similar data points that are present today, it would be wise for investors to consider the implications.
Need some help staying on the right side of the markets? Join the BullBear Traders room at TheBullBear.com. You'll get this kind of timely, incisive, unbiased stock and financial market trading, timing, forecasting and investment technical analysis and commentary daily. It's free to join, no credit card is required and if you like my work you just make a donation at the end of each month.

By Steve Vincent
Steven Vincent has been studying and trading the markets since 1998 and is a member of the Market Technicians Association. He is proprietor of BullBear Trading which provides market analysis, timing and guidance to subscribers. He focuses intermediate to long term swing trading. When he is not charting and analyzing the markets he teaches yoga and meditation in Los Angeles.
© 2011 Copyright Steven Vincent - All Rights Reserved Disclaimer: The above is a matter of opinion provided for general information purposes only and is not intended as investment advice. Information and analysis above are derived from sources and utilising methods believed to be reliable, but we cannot accept responsibility for any losses you may incur as a result of this analysis. Individuals should consult with their personal financial advisors.
© 2005-2022 http://www.MarketOracle.co.uk - The Market Oracle is a FREE Daily Financial Markets Analysis & Forecasting online publication.