Stock Market Intermediate Low Confirmed, Corrective Pattern?
Stock-Markets / Stock Markets 2012 Jul 02, 2012 - 02:21 AM GMTBy: Andre_Gratian
 Current Position of the Market
SPX: Very Long-term trend - The very-long-term cycles are down and, if they make their lows when expected (after this bull market is over) there will be another steep and prolonged decline into late 2014. It is probable, however, that the steep correction of 2007-2009 will have curtailed the full downward pressure potential of the 120-yr cycle.
SPX: Intermediate trend - SPX is probably putting the finishing touches on an intermediate-term bottom.
Analysis of the short-term trend is done on a daily basis with the help of hourly charts. It is an important adjunct to the analysis of daily and weekly charts which discusses the course of longer market trends.
Market Overview
By holding above 1305 and rallying, the SPX confirmed the 1267 low as an intermediate bottom. Friday's surge took the index to the highest level of that three-week period and suggests that it may now be in a position to re-test the May high of 1415 before the move comes to an end. What follows will be closely monitored, because it could turn out to be an important top.
Several questions were answered by last week's market action. The distribution pattern that had been created at the 1363 high had produced a projection down to 1305/1310 which was met last Monday when the SPX traded at 1309.27. That level was re-tested on Thursday, and the subsequent rise above 1334 on Friday ensured that the trading that had taken place above 1305 was accumulation and not distribution. It also laid to rest the possibility that the 2-yr cycle was still ahead of us and could drive prices lower.
The trigger for the surge which started on Thursday was the news that the Eurozone had made some tangible progress in its attempt to resolve its economic problems. The buying/short-covering rally has enough momentum to initially carry the SPX to about 1374/1377 and, after a minor correction, probably push higher to the low 1400s. What happens after that could be of concern, because there are already some indications that an important top could materialize at that time. But we don't have to dwell on that right now since we still have a few weeks before we need to make that evaluation. Our immediate task is to track the rally to see if it has the potential of reaching the objectives that we have set for it.
Chart analysis
As the Daily Chart shows, the short-term and intermediate trends were clarified on Friday when the SPX rallied strongly to extend the move which it started on 6/04 from 1267. After breaking out of a short-term down-channel, the index found resistance at the top of a larger channel and retraced a little more than 50% of its uptrend before finding support. Friday's surge has already taken it near the top of that channel in a challenge of its previous high.
The base established on the P&F chart gives the initial spike a projection to 1374-1377, a level which roughly corresponds to the top of the green channel. Resistance at that level should cause it to have a minor correction, perhaps similar to the one which occurred in mid-course during the first phase of the rally. After this pull-back, the SPX should be able to rise to its ultimate intermediate destination -- slightly above 1400.
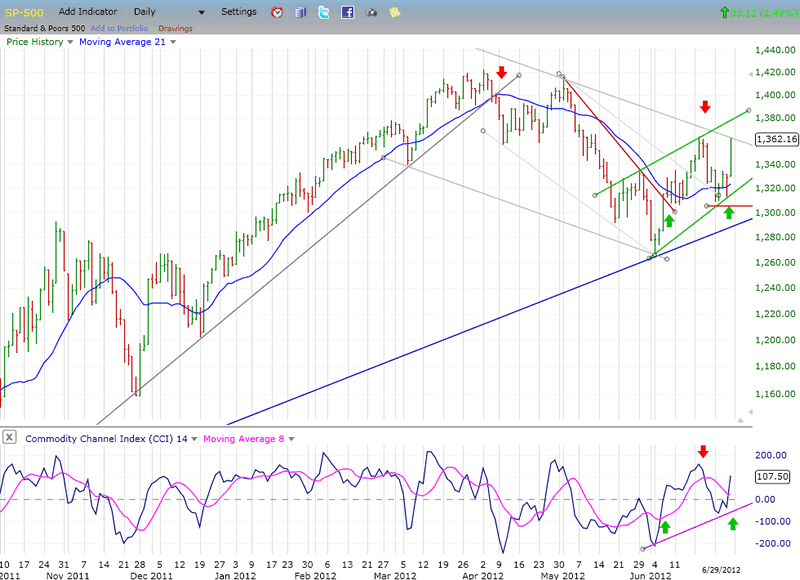
If the first market correction from 1422 is construed to be a 5-wave pattern, and if the rally which is currently taking place ends up being a corrective phase, we should be prepared for the possibility that a serious decline will follow. Let's not forget that we are expecting a great deal of weakness into late 2014 as a result of the bottoming 120-year cycle. With the pattern which is currently under construction, it is possible that 1422 will turn out to be the top of the next bear market.
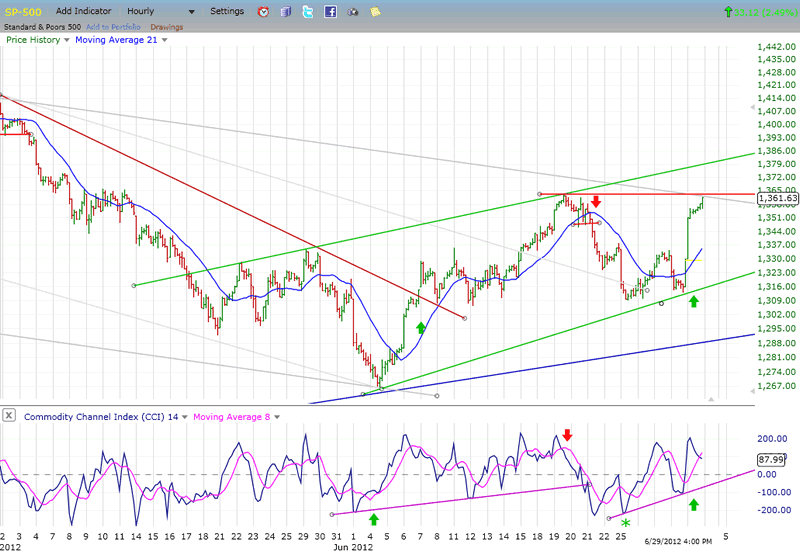
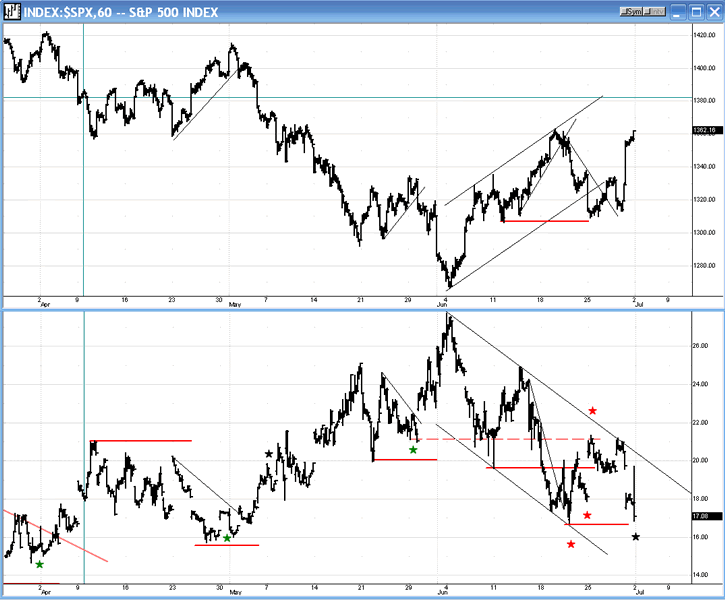
Let's now turn to the Hourly Chart for an analysis of the near-term trend. Friday's surge retraced the entire length of the near-term correction all at once and took the SPX to the top of its intermediate channel. It would not be surprising if the resistance at this level caused some consolidation but it is more likely that the initial momentum will carry it to its 1374/77 target before it pulls back.
The strength of the move had caused the indicator to reach an overbought level, but it has already somewhat corrected that condition and may be ready to take the index to its interim near-term target.
Cycles
The resumption of the rally from 1267 has put to rest the view that the 2-yr cycle low might still be ahead of us. It now appears that it bottomed in early June and is the basic cause of the current rally.
The mid-June top was caused by a small cluster of cycles. This action could be repeated in early August when more important cycles are due which could cause a more important top.
Breadth
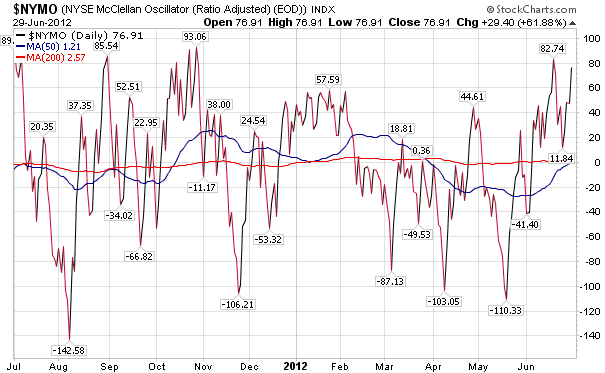
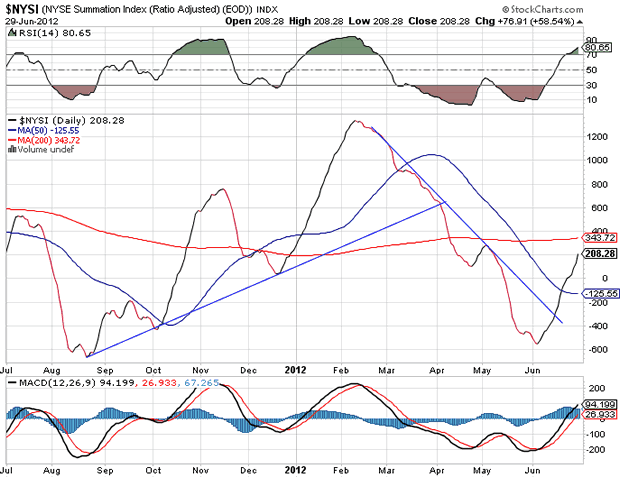
The NYMO and NYSI (courtesy of StockCharts.com) are shown below.
During the pull-back into last Monday, the NYMO corrected but remained positive and in an uptrend. This has caused the NYSI to extend its own uptrend. Until we see a reversal of this trend, we can expect the stock market rally to continue. The RSI has barely reached overbought and, as we can see from its past action, it can stay in that condition for some time. When it starts to turn down, it will be a warning that a correction is due.
Sentiment Indicators
The VIX
On the chart below (courtesy of Qcharts) we see that the VIX never confirmed the downtrend in the SPX and remained in a downtrend itself in a well-defined channel. The closest it came to confirming it was on Thursday when it touched the top trend line, but it could not go through and reversed immediately when the SPX began to rally. It is now in perfect sync with SPX, closing near its low while the SPX closed near its high. It is likely that it will make a new low if the latter makes a higher high.
On Friday, VIX touched 17 and closed at 17.08. Its P&F chart gives it a potential move down to 14. When it gets there and begins to show some divergence to the SPX, it will be time to look for an end to the market rally.
XLF (Financial SPDR)
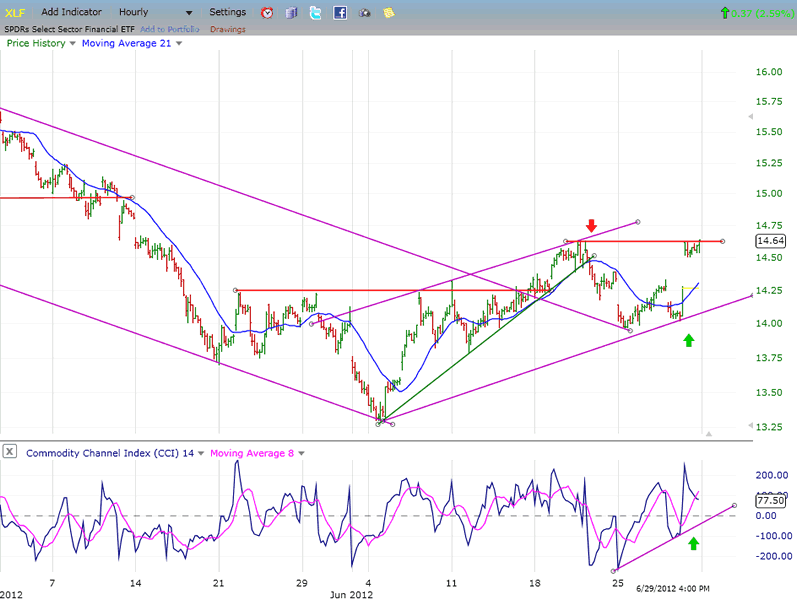
There is very little difference between the hourly chart of XLF and that of the SPX. If anything, the XLF chart is a trifle more positive because, on Friday it closed fractionally above its mid-June high. This is another indication that the market rally probably has farther to go.
This positive divergence is even more pronounced when we compare the Dow Jones Industrials to the Dow Jones Financial index. That was not the case when the DJIA made a new high on 5/01. At that time, the DJ Financials failed to make a new high by a good margin, thereby forecasting a reversal in the DJIA.
The resemblance between XLF and SPX extends to their indicators. The patterns are practically identical. Both gave a buy signal at the same time, and both are in an uptrend. When they start to diverge, it will be time to look for a correction.
The reason I show a chart of the XLF is because, like the VIX, it tends to warn of impending reversals in the SPX. I expect XLF to give a warning that SPX is approaching the end of its rally by showing some negative divergence to the latter.
BONDS
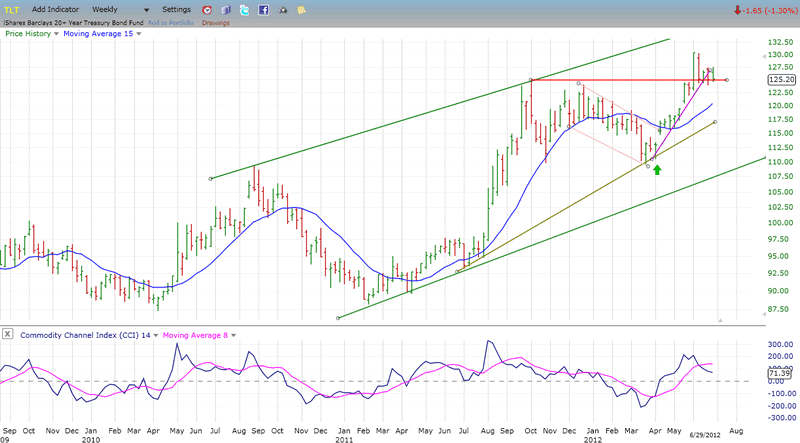
Below is a weekly chart of TLT. It is in a solid long-term uptrend which shows no sign of ending. A few weeks ago, the index made a new high, pulled back to the level of the former high, and has traded sideways for four weeks without violating that support. The overall action probably means that we should take the Fed chairman at his word, and that interest rates will be held at their current level for a couple more years.
UUP (Dollar ETF) Daily Chart
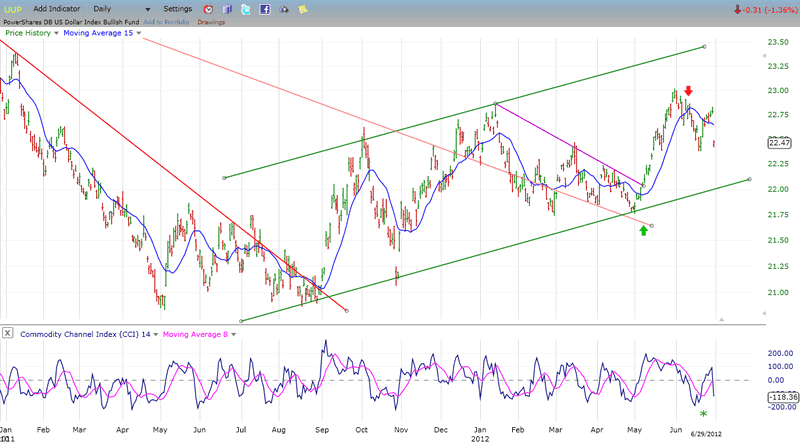
The sharp rally experienced by the Euro on Friday caused UUP to back off proportionally, but it has not altered its long-term uptrend, nor is it expected to do so anytime soon. The Point & Figure chart of this index formed a base between May and September of last year which gives it a projection to 25. This is equivalent to a move up to 90 for the dollar.
If the proposed scenario for the SPX is correct, the current correction in UUP should continue until the first week in August, after which it should resume its long-term uptrend.
GLD (ETF for gold)
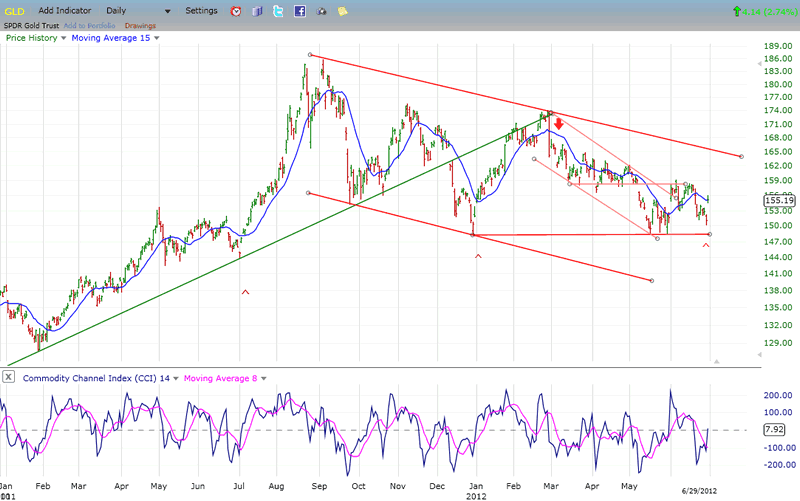
GLD (daily chart above) has been correcting for nine months and, if it does not take advantage of the 25-wk cycle -- which just made its low and should exert some upward pressure -- to climb above its long-term downtrend line, gold bulls may have to wait until November for the next opportunity to resume the long-term uptrend (most likely from a lower level).
Near term, since GLD is essentially in sync with the SPX, we could expect it to join the latter in an uptrend which has a potential target of 161/162.
OIL(USO)
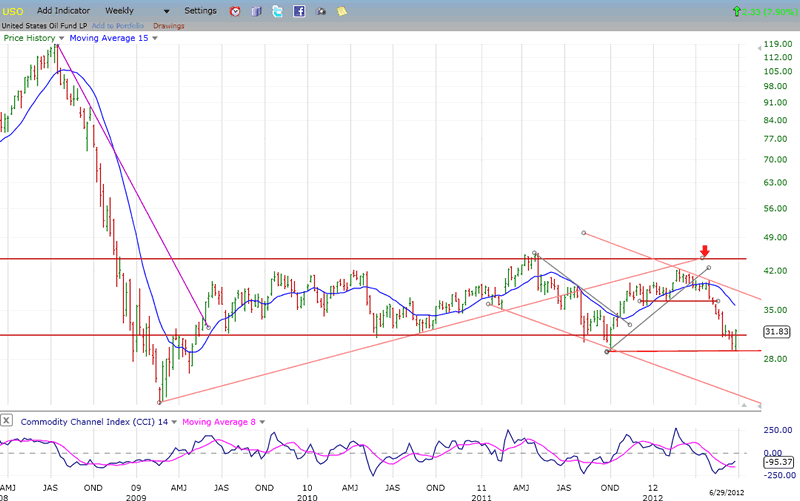
We'll get a better feel for what oil is doing if we look at a weekly chart of USO going back to its 2008 top. This is a very weak index and, considering its lack of participation in the bull market which started in 2009, it is very likely that USO is on its way to much lower prices before it reaches a long-term bottom. I mentioned in a previous article that the P&F chart calls for a potential low at about 8.
When you look at this chart, you can see that the target is not as far-fetched as it first sounds.
FXI (iShares China 25 ETF)
I want to show you one more chart which could shed some light on where the SPX may be heading in a few weeks. We know that some Eurozone countries have serious economic problems that are already weighting heavily on their stock markets, some of which are already in bear trends.
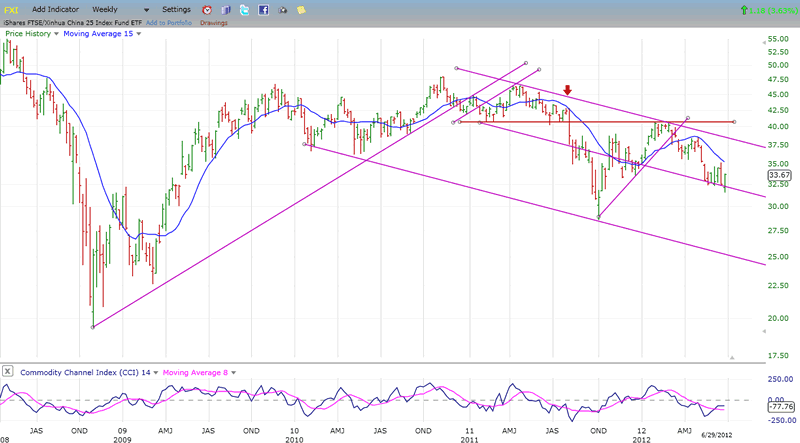
Another country which can have a major impact on the world's economy is China. It has started to show deceleration in its rate of growth and, since China is a big consumer of commodities, this has already had a significant impact on the commodity index which started to decline when the FXI made its bull market high in early 2011.
FXI is currently quite a bit weaker than the SPX and, like some of the Eurozone markets, already seems to be in a bear trend. It would appear that the bottoming 120-yr cycle is already affecting some major stock markets and that it's only a matter of time before SPX joins them in a protracted decline. This is why it will be important to continue monitoring the FXI and the European markets, and to keep a close eye on what SPX does after it comes to the end of its intermediate uptrend (probably in early August).
Summary
From last week: "The near-term direction of the stock market will, to some extent, depend on what is decided at the Eurozone summit scheduled for next Thursday and Friday."
The agreement reached by summit participants had a significant impact on the market, propelling the SPX to a 33-point surge on Friday. This initial momentum should extend the rally from 1267 for another few weeks. When it ends -- probably in early August - we should consider the possibility that the index will be ready to resume the decline which it started from 1422.
FREE TRIAL SUBSCRIPTON
If precision in market timing for all time framesis something that you find important, you should
Consider taking a trial subscription to my service. It is free, and you will have four weeks to evaluate its worth. It embodies many years of research with the eventual goal of understanding as perfectly as possible how the market functions. I believe that I have achieved this goal.
For a FREE 4-week trial, Send an email to: ajg@cybertrails.com
For further subscription options, payment plans, and for important general information, I encourage
you to visit my website at www.marketurningpoints.com. It contains summaries of my background, my
investment and trading strategies, and my unique method of intra-day communication with
subscribers. I have also started an archive of former newsletters so that you can not only evaluate past performance, but also be aware of the increasing accuracy of forecasts.
Disclaimer - The above comments about the financial markets are based purely on what I consider to be sound technical analysis principles uncompromised by fundamental considerations. They represent my own opinion and are not meant to be construed as trading or investment advice, but are offered as an analytical point of view which might be of interest to those who follow stock market cycles and technical analysis.
Andre Gratian Archive |
© 2005-2022 http://www.MarketOracle.co.uk - The Market Oracle is a FREE Daily Financial Markets Analysis & Forecasting online publication.


