


High Government Deficits "Crowd Out" Stock Market Returns
Stock-Markets / Government Spending Jul 12, 2012 - 02:44 PM GMTBy: Dan_Amerman

 “Crowding out” is an obscure term if you're not an economist – but this replacement of the private sector economy with government spending may end up being one of the largest determinants of your standard of living during retirement. The investment problem is that the past, present and likely future of the US economy is one of rapidly growing government spending. Because the investment models that drive conventional financial planning assume a rapidly growing private sector, this sets up a fundamental competition between government growth and private sector growth for their shares of a single economy, and may lead to a collapse of stock market values and conventionally invested retirement portfolios.
One of the sharpest economic changes in our lifetimes occurred between 2007 and 2009, as the private sector share of the United States economy collapsed to a depression level. About 75% of the collapse in the private sector was (and is) hidden by an explosive increase in government spending, which could not be paid for by taxes, but has instead created a "new normal" of fantastic annual government deficits without end.
The current trillion dollar plus annual deficits which are used to cover up the continuing "hole" in the economy are not stable, however, but merely serve to "bridge" the gap between the private sector collapse and the rapidly accelerating future deficits that will be required to pay for Boomer social security and Medicare promises, as well as the increasing amount of the economy devoted to government transfer payments.
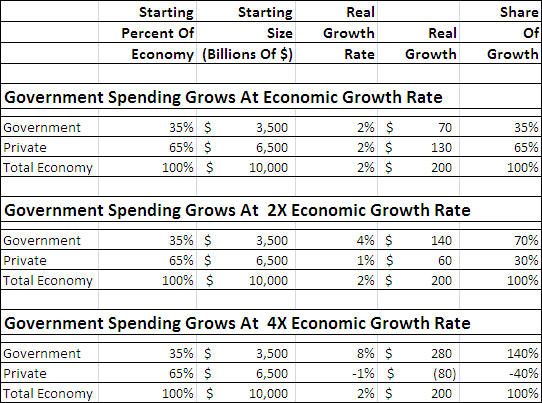
On the most fundamental of levels, stock market valuations and traditional long-term investing are based upon a dependably growing private economy. However, when government spending is surging at rates sufficiently far in excess of overall economic growth, this means that the private economy is necessarily barely growing - or even shrinking. Therefore, the current situation creates a long-term and highly bearish scenario for stock valuations.
The ripple effects of the government competing with the private sector for the limited real resources of the future may potentially collapse most pension funds – and their government and corporate sponsors – across not only the US, but the rest of the developed world.
The Plunge Of 2007-2009
The United States government has always been a voracious spender, but the percentage of the economy consumed by the government began soaring when the financial crisis hit in 2008.
As shown with the blue bars and the chart below the graph, the size of the US private sector economy plunged by $1.3 trillion between 2007 and 2009 - and it hasn't come back.
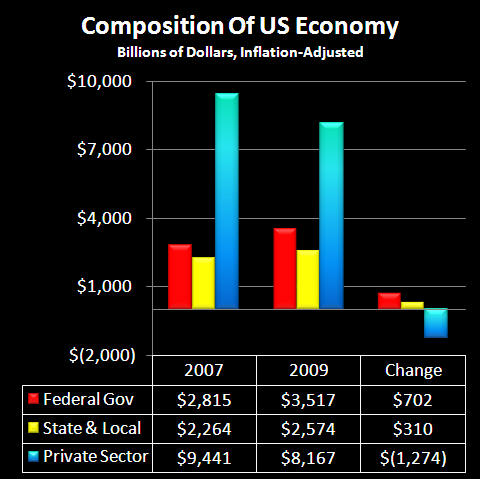
Yet, we don't see the full extent of this plunge around us on the streets or in the headlines. Indeed, despite this ongoing, gaping hole in the US economy, the official story is that the US isn't even in a recession. How can this be?
The answers can be found in the red and yellow bars above, representing Federal government spending and state and local government spending. Federal spending rose by $700 billion, and state and local government spending rose by $300 billion. (As the state and local spending increases were generally being funded by Federal government transfers that have been netted out, it was really almost all growth in Federal spending.)
So, the private economy plummeted by $1.3 trillion while the government economy soared by $1 trillion, and we were left with what looks like a much more manageable $300 billion shrinkage. In other words, a little over 75% of the collapse in the private economy was (and is) being covered by increased government spending.
(Inflation adjustments are based upon the official GDP deflator as of 7/1/07 and 7/1/09, which I and many others believe to understate inflation. With a higher and more realistic rate of inflation, the shrinkage in the real economy is significantly greater.)
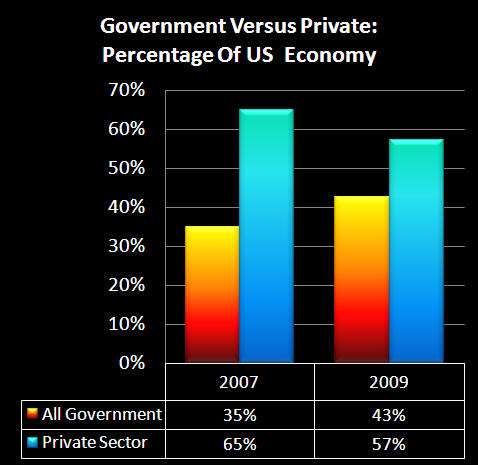
As shown in the graph above, there has been a radical shift in the composition of the US economy, with the government share of the economy leaping from 35% to 43%. The $1 trillion "hole in the economy" from 2008-2009 is still there, and is still being covered by the (not at all coincidental) abrupt increase in federal deficits by about $1 trillion per year. If federal spending and deficits were to suddenly drop to pre-crisis levels, then the cover-up would end, and the true post-2008 economy would become plain to see - as a yet-to-be-cured depression.
This is perhaps the most rapid and greatest change in the fundamental nature of the US economy since World War II - yet there has been remarkably little discussion of the full consequences for long-term investors.
The "New Normal" Of Massive Deficits
Total US federal government spending is now up to around $3.5 trillion, including about a $1.3 trillion budget deficit. (This is the official figure based on governmental accounting standards – the use of which standards could lead to fraud charges if a private business attempted it, but we’ll use it as a conservative estimate.) Net of government transfers, state and local government spending totals about another $2.5 trillion, for total government expenditures of over $6 trillion per year.
In order to maintain total government spending at its "new normal" of a little over 40% of the total economy, then absent major tax increases, annual federal budget deficits are required to be in the extraordinary range of 8%-9% of the size of the total economy on an ongoing basis. The approximately $1 trillion dollar increase in the size of the average annual deficit means that the cumulative federal debt is rising at a much faster level, and now exceeds 100% of the size of the national economy of about $15 trillion per year.
Soaring Future Deficits
Federal debt equalling 100% of the gross domestic product is an astonishing enough number by itself - but it appears that we are still just getting started. We need to take into account – which government accounting does not – the rapidly approaching $62+ trillion crisis with Social Security and Medicare, that dwarfs the current financial crisis. We need to include the costs of paying for health-care and other transfer payments as well. We also need to take into account the costs of likely bailing out the state governments (such as California and Illinois) on their fiscal and pension liabilities, and eventually many municipalities as well.
When we add it all up, what we clearly have is a rate of government spending that is leapfrogging ahead of the growth in the real economy, as the government consumes more and more of the resources – as well as an ever greater share of the investment capital – available within the US economy.
It is important to note that while I am using the example of the United States, the US is far from the only nation with these issues. All across the world we have developed nations that are in the midst of monetary crisis, and these nations have their own looming retirement and health care problems with their aging populations. The private investment effects of government spending rising more rapidly than total economic growth is a global issue.
Exponential Retirement Investment Expectations
Now, let's explore how this rapidly growing government spending directly affects pension funds, as well as the many millions of individual retirement investors whose portfolios aren’t worth anywhere near as much as they had been told that they could expect. To understand the interrelationship, we need to understand the financial models that drive these retirement investments, and why the retirement investment system is in such crisis at this time.
The fundamental issue is that conventional retirement planning is not really about stocks or bonds at all – but exponential mathematics. Retirement investing is not based on earnings today. Retirement and other long-term investing is based on assumed future investment earnings that must occur. These earnings must not only occur, but they must grow every year and most importantly, they must exponentially compound.
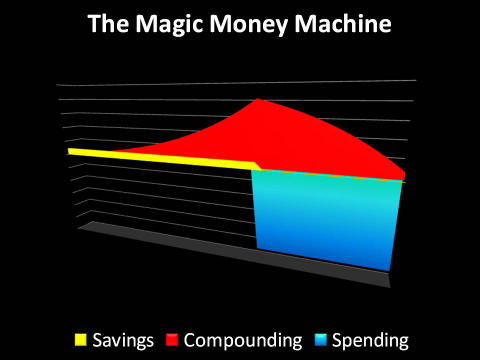
The core of conventional retirement investing is illustrated in the graph above from my video/text article, “The Retirement Magic Money Machine". The thin yellow line represents actual savings, or pension fund contributions. The fat and growing red area is assumed exponentially compounded investment earnings, where the assumption of earnings upon earnings and then earnings upon earnings upon earnings dwarf the actual savings contributions. Which leads to the beautiful blue bar of a prosperous retirement for all. For this particular illustration we assume an 8% earnings and exponential compounding rate, which has long been considered fairly reasonable for long term retirement planning.
When we look at that blue bar – very little of it actually comes from savings. Future earnings – and then earnings upon earnings – must reliably occur, or the retirement that all these many millions of investors have been told they can expect, simply won't be there for them. Therefore, with investors who have entered into contractual obligations based on their belief in this model – that is, government and corporate traditional pension plans – their very financial survival depends on these fantastic levels of compounded earnings in the future, or they simply won't be able to pay.
A Limited Pie
Here's a simple but vital question: where does the real wealth come from to pay the pension funds and the private retirement investors (as well as all other investors) their exponentially compounded wealth in real goods and services? For in order for millions of retirees to be able to actually pay for things like housing, utilities, energy and food and so forth, we need the real economy rather than just paper wealth. If retirement wealth is not only to grow on paper, but to actually be cashed out and consumed in retirement by retirees, there must be a corresponding growth in the real economy.
A succinct summary of the economic theory underlying conventional retirement investing is as follows: long-term investors produce more real goods and services than they consume. This excess of production over consumption is economic savings, and these savings are invested in growing the real economy. The economy then generates the real wealth which enables the long term investors to enjoy a prosperous retirement when they cash out their share.
This creates a natural question about the practicality of the prevailing retirement investment theory: how much real growth does the economy actually generate?
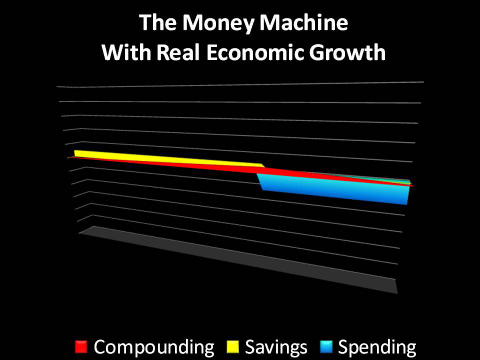
The dramatic difference between the above graph and the previous “Magic Money Machine” graph can be found in differing earnings rate assumptions. With the first graph we took a relatively common retirement investment assumption of 8%. In this second graph we take a look at the real (after-inflation) per capita average economic growth rate of the United States over roughly the last 50 years or so, which has been about 2% per year.
The yellow bar is the exact same size in each graph, meaning that the retirement investor or the pension fund is making the same savings contributions. However when we reduce our exponential compounding rate from 8% to the 2% that corresponds to real per capita economic growth, that means that reinvestment earnings shrink from the vast red area in the previous graph down to the thin red line here. Which then means that the prosperous blue bar of retirement is a tiny fraction of what it was with the first example. When we look at real economic growth and compare it to wealth expectations, there are likely to be many millions of very disappointed people. As well as numerous effectively bankrupt pension funds.
Through conventional retirement planning and pension fund investments, society essentially agreed that the average person can become wealthier than the average person. The reality check will likely be devastating.
The above is a short summary of The Mythical Retirement Magic Money Machine, the full video and article are available at the link below:
http://danielamerman.com/articles/archive/magic.html
Unfortunately however – it gets worse, because there is an implicit assumption that the retirement investors can compound their wealth at even a 2% rate. In other words, we’re assuming investors get their full share of economic growth. But the problem is that there is only one economy. There's not one economy for investors and pension funds, and another separate economy for the government to take an ever bigger share. The government is taking its bigger share of the economy out of the same limited economic pie that the retirement investors and pension funds were counting on for their own real wealth.
The Inevitable Collision: Crowding Out
“Crowding out" is a term used to describe what happens when a government competes for limited resources with the private sector. The term is generally used for government borrowing. During periods of rapidly rising deficit spending the government is issuing large quantities of bonds, each of which carry the full faith and credit of the government. Because it is the government, the government also has the ability to effectively pay whatever interest rate it needs.
Private sector bond issuers find this a very difficult one-two combination with which to compete, when trying to obtain funding from private bond investors. So when the government sells too many bonds in order to finance deficit spending, it is said to “crowd out” private-sector borrowers, who have less ability to borrow and must pay higher interest rates than they otherwise would. Because less funding is available for business growth, this means that the essential side effect of crowding out is to slow the overall economic growth rate.
This concept can also be applied to the overall economy and to investment markets in general. Indeed, this may be the most important interpretation of all when it comes to determining not only personal and pension fund investment returns, but the long term standard of living for retirees and those investing for retirement.
Daniel R. Amerman, CFA
Website: http://danielamerman.com/
E-mail: mail@the-great-retirement-experiment.com
Daniel R. Amerman, Chartered Financial Analyst with MBA and BSBA degrees in finance, is a former investment banker who developed sophisticated new financial products for institutional investors (in the 1980s), and was the author of McGraw-Hill's lead reference book on mortgage derivatives in the mid-1990s. An outspoken critic of the conventional wisdom about long-term investing and retirement planning, Mr. Amerman has spent more than a decade creating a radically different set of individual investor solutions designed to prosper in an environment of economic turmoil, broken government promises, repressive government taxation and collapsing conventional retirement portfolios
© 2012 Copyright Dan Amerman - All Rights Reserved
Disclaimer: This article contains the ideas and opinions of the author. It is a conceptual exploration of financial and general economic principles. As with any financial discussion of the future, there cannot be any absolute certainty. What this article does not contain is specific investment, legal, tax or any other form of professional advice. If specific advice is needed, it should be sought from an appropriate professional. Any liability, responsibility or warranty for the results of the application of principles contained in the article, website, readings, videos, DVDs, books and related materials, either directly or indirectly, are expressly disclaimed by the author.
© 2005-2022 http://www.MarketOracle.co.uk - The Market Oracle is a FREE Daily Financial Markets Analysis & Forecasting online publication.