


Where Do the Stock Markets Go From Here?
Stock-Markets / Stock Markets 2012 Jul 14, 2012 - 12:40 PM GMTBy: Tony_Pallotta

 This week's macro view I want to spend focusing on the current market. However you want to describe it, Friday's market was odd. The best way I can describe the price action is "someone" big in the FX market did "something" big. The ramp at the open in the EUR and subsequent USD selloff on no news is something I have never seen before.
And since the FX markets are bigger than the index equity futures, I believe that is where the fuel came for the "rally." And where it gets really odd and highlights how confused and exhausted traders are is once the move was done, the day was basically over. Low volume ensued and everyone seemed afraid to fade the rally.
Volume dwindled and in fact if you look at the Russell, price simply churned as buyers and sellers offset one another. Then into the close EMD (mid cap futures), a non-retail product put in a very high volume selloff, nearly double the volume of the opening candle.
The reason I mention this is I believe the Friday candle needs to be highlighted for the lack of quality it represented. Sure it happened and it's on the chart but in many ways, as this weekend's video highlighted, things are not always as they appear.
But the psychological damage was done. Emotionally exhausted traders were smacked down again. All believe we are setting up for higher highs. And perhaps we are. My goal with this post is not to justify what I want to happen. Trust me at this point I just want a tradable trend beyond 48 hours. But I also will not succumb to group think, take Friday's ramp for more than it may be and talk about a new bull leg.
In many ways, as the macro picture deteriorates, whether it be the reality of recession or sharp deterioration in corporate profits (sorry, but earnings season is horrible right now) this market is on fumes.
So today I want to present four analogs. And as I always do prior to showing these, want to explain how they are more than just candlestick patterns. I don't look at candlesticks. I don't look at trend lines. I have become 100% dependent on the model. And I am using these analogs as the next best thing I can use to show you what I am seeing.
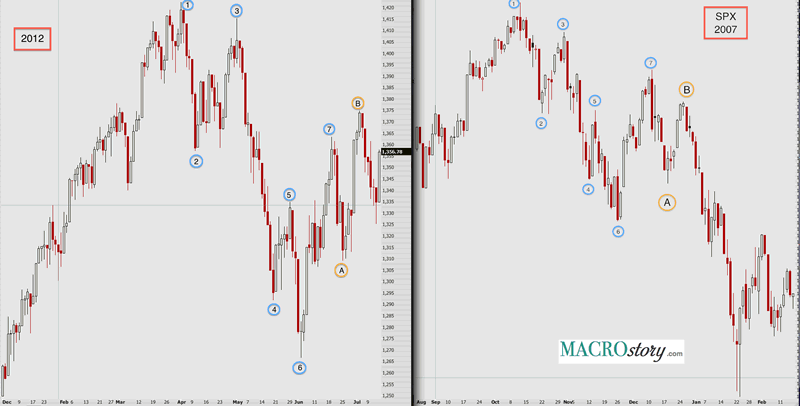
2007 Analog
Let me go back to the first analog I began showing. I still find this valid. If Friday's market sold off into the close we wouldn't even be having this talk. We would be looking at one analog still and personally I would be amazed at how well it was still working.
The one caveat that concerns me about this analog going forward is where it closed. It closed above the 1,348 area. A level that should have held. But in the context of what likely drove this move, markets being down for six consecutive days and the past number of Friday's catching a bid (this time apparently in hopes of a Chinese stimulus over the weekend) the fact that highs were held and therefore 1,348 makes some sense. But to be fair, that level not holding weakens this analog.
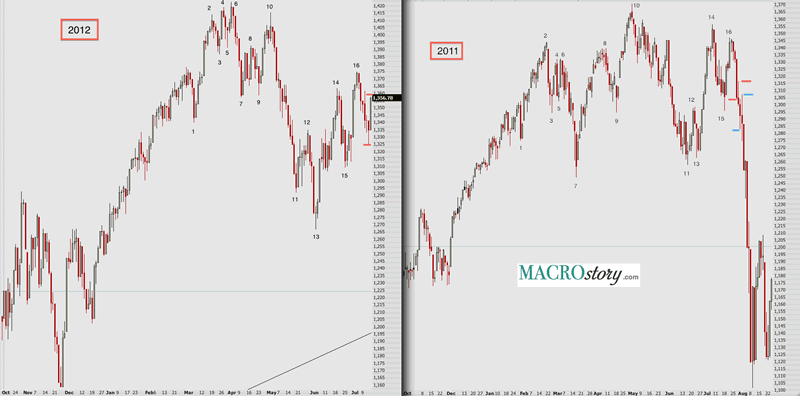
2011 Analog
The text above for the 2007 analog pertains to this as well including failure to hold the 1,348 level. But this analog in my view holds a little more weight. Notice the intraday retraces experienced after Point B was put in as highlighted by the red and blue horizontal lines. Again if markets had sold off into the close on Friday the 2011 analog would still be extremely valid.
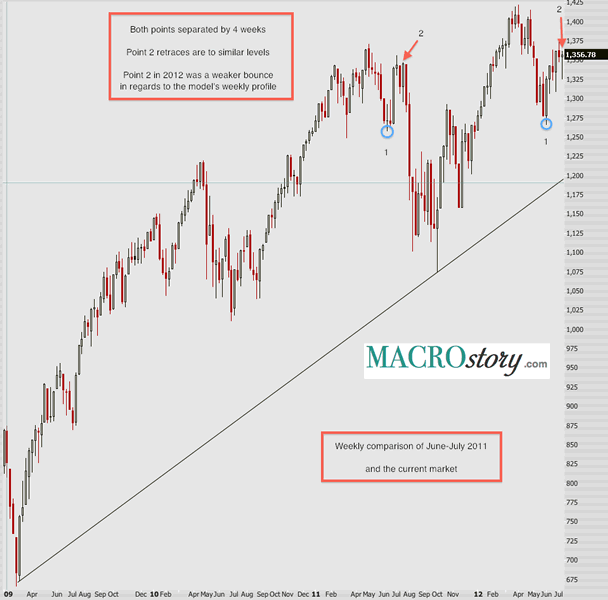
2 Year Weekly
This takes the 2011 analog and current market and looks at them with weekly time frames. And here I am getting a good signal. The model remains short the SPX (and other indices) on a weekly and the key level (comparable to 1,348 on the daily as mentioned above) held. In fact the prior week also failed to take out this level.
Additionally there are four weeks duration between the low and highs on each so the cycle time is similar. As is the retrace as shown by the red arrow. And lastly put yourself back on Friday of point 2 in the 2011 market. Using a weekly candle it would look pretty bullish. Markets closed on the highs in a pretty solid up candle. Only to be knocked down hard the following week.
As I have often discussed, sometimes it is helpful to mentally put yourself in prior markets just before a major move. Imagine the confusion at that very moment just before the trend explodes.
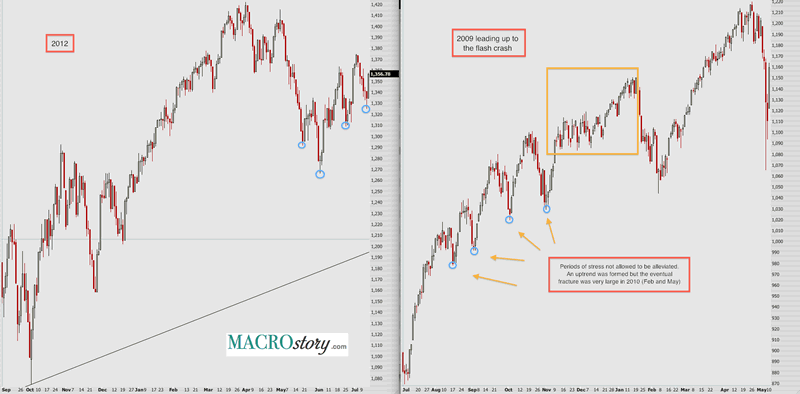
2009 - 2010
This is the only other time I can find an uptrend where key model levels were violated multiple times and markets moved higher. So it is possible we are in a similar scenario. But two things to point out about this. First, it came after the market was extremely oversold in 2009. And second, these inabilities to let stress relieve itself (as discussed in the video and highlighted by the blue circles) set up two very sharp selloffs in Feb and then May (Flash Crash) of 2010.
Bottom Line
My gut right now still says we are in the 2011 analog. Part of the basis for that statement is the price action in the USD at a two year high and Treasury at all time highs. Add in the macro reality of recession (hard to deny at least a major soft patch), removal of additional Fed stimulus, European credit event now going global, corporate earnings rolling over fast, I can go on but won't.
The key test though will be how much further this market can retrace higher. If it does go much higher then the 2009-2010 analog would likely be the path we are on. What's scary about that is the trend is anything but clear. Just look at the moves up and down. Both longs and shorts would struggle in such a market.
I've been adamant about being patient here and not front running this market. Until we get further confirmation. That may come on Tuesday when Chairman Bernanke testifies before Congress. That will hopefully finally end this QE nonsense. Earnings will also start coming in very heavy. As a reminder from the video, earning warnings are at levels last seen in 2008. It is not a good earnings season.
So let's just be patient here. Let's manage risk. I have a small short position on based on the weekly signal and did roll July into August so I have more time on this trade. But it is a rather small position.
By Tony Pallotta
Bio: A Boston native, I now live in Denver, Colorado with my wife and two little girls. I trade for a living and primarily focus on options. I love selling theta and vega and taking the other side of a trade. I have a solid technical analysis background but much prefer the macro trade. Being able to combine both skills and an understanding of my "emotional capital" has helped me in my career.
© 2012 Copyright Tony Pallotta - Disclaimer: The above is a matter of opinion provided for general information purposes only and is not intended as investment advice. Information and analysis above are derived from sources and utilising methods believed to be reliable, but we cannot accept responsibility for any losses you may incur as a result of this analysis. Individuals should consult with their personal financial advisors.
© 2005-2022 http://www.MarketOracle.co.uk - The Market Oracle is a FREE Daily Financial Markets Analysis & Forecasting online publication.