U.S. Federal Reserve Delivers 50% Higher Stock Market Pavlovian Premium
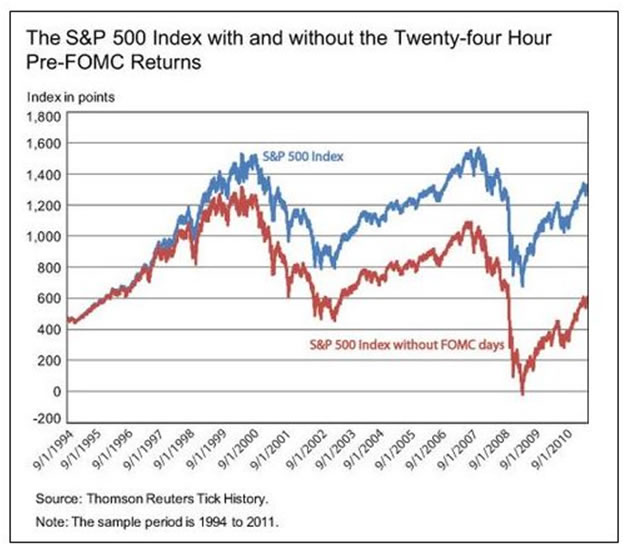
Stock-Markets / Stock Markets 2012 Jul 14, 2012 - 12:52 PM GMT The U.S. Federal Reserve Bank of New York has just released what is essentially a stock market manipulation bragging rights report. Based on their research, they have concluded that stock prices would be 50% lower if they had not worked their magic with interest rates, quantitative easing (QE) and various other tools in their monetary toolbox, as announced at the regular Federal Open Market Committee (FOMC) meetings. The report concludes that the U.S. Federal Reserve, by providing sufficient liquidity, has produced a stock market valuation pavlovian premium since 1994. They even produced a few charts to prove it.
Investors and traders need to realize that as central bank efforts have increased in recent years, the stock market premium has also increased. The chart below comes from the report released by the New York Federal Reserve Bank. The blue is the S&P 500; the red subtracts the market action for the 24 hours preceding the release of FOMC announcements on the days of the meetings. There clearly is an expanding FOMC pavlovian premium response since 1994. Markets consistently rally in expectation of a liquidity bone from the U.S. Fed. It is now worth pondering what happens when the central banks run out of bones to secure the pavlovian premium and the gap closes.

Analysis of the stock market cycles concurs with the report that the U.S. Fed does deserve bragging rights for this central planning feat of market manipulation. There is mounting evidence that central banks did effectively put in higher price lows in the cycles with regular liquidity support operations. Maybe we should all be thankful, maybe not, only time will tell. The growing problem is not liquidity it is insolvency. If the stock market remains artificially high, but the global financial system is essentially bankrupt, it cannot end well.
Of course, the U.S. Fed was not alone. Like the U.S. Fed, the ECB's LTRO program effectively transferred risks from those that created the risks, and transferred it to parties that had nothing to do with the risks, the public. This risk shifting has clearly lengthened the global stock market cycles and produced higher lows on more than one occasion.
While the stock market support accolades are being dispensed, it should be recognized that the ECB's LTRO program was even more creative than the U.S. Fed in their objective to keep the system afloat. They did not just purchase bad debt. They changed the maturities of the debt that they shifted from the guilty parties onto the innocent parties. Essentially, what the ECB did is take risks coming due in one business cycle and transferred it to the next business cycle. This risk shifting impacts current market action, but the bill comes due in the future. The real growing question now is what such aggressive central bank intervention in the present does to future economic growth and market cycle pricing.
What the central banks of the world are not explaining, including the U.S. Fed, ECB, BOJ or PBOC, is that present risk shifting to produce the market premium and higher lows in the cycles, will be paid for in the future, in one form or another. It may be a much lower GDP and slower growth in the next cycle or much lower stock prices in the next cycle, or both. Before you send congratulations to the central banks for their market support operations, give the global markets a cycle or two to sort out the chaff from the wheat.
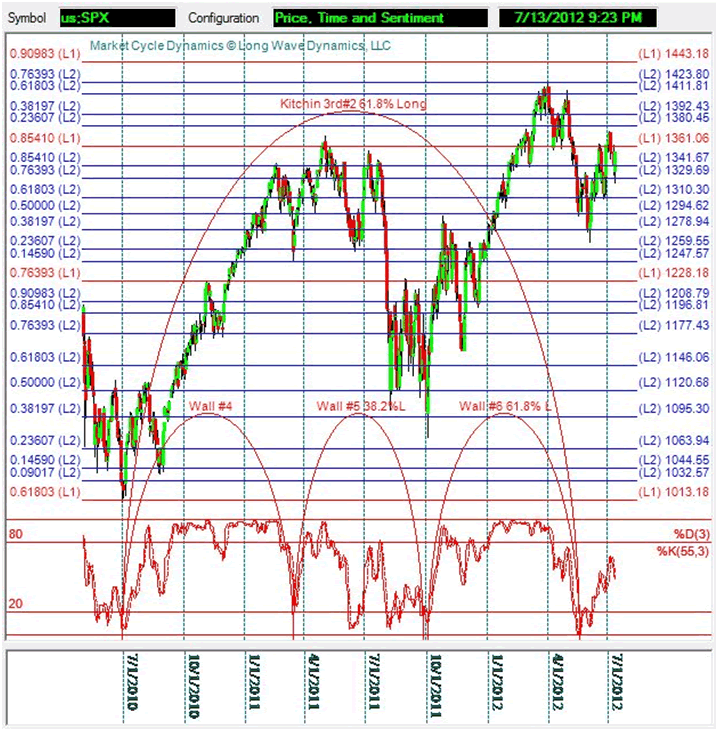
With central banks manipulating the markets and the cycles, and with the world financial system falling apart, how in the world do investors and traders anticipate market rallies like the one that began in June? Clearly, central bank intervention has expanded the cycles and put in a higher low. Even so, the impending cycle turn was signaled in advance with the combination of price, time and sentiment. The heartbeat of global financial markets, the Wall cycle, made its inevitable turn. The pendulum of human action made the anticipated swing from pessimism to optimism.
Stock market cycles can be distorted by central banks, but they cannot be eradicated. Just like prices that are influenced and bounded by Fibonacci ratios, the cycles appear to be guided and bounded by Fibonacci ratios in time. Cycles are dynamic forces of human action, the action of central bankers, investors and traders.
Central bank intervention can delay the cycles, but like particles in a quantum field, the cycles of human action have degrees of freedom in Fibonacci ratios in time. The ideal Wall cycle is about 142 days, or twenty weeks, but if you pump cash into them, they expand. The golden ratio of 61.8% is one of the more important degrees of freedom in market cycles, not to mention all natural and living systems.
The Wall cycle was showing signs of rolling over hard globally in late 2011. The European financial system was in gridlock and on the verge of failure. The U.S. was not far behind. The concerted central bank action gave the Wall cycle more life. Central banks did in fact put a bid under global markets and the cycle expanded. The impact is evident on cycle charts. However, by early April the impact of the liquidity injection was waning. The cycle began turning down. The central bank pavlovian premium delivered an expanded and higher cycle low in early June.
Investors and traders that were aware of the golden ratio extension of the Wall cycle anticipated the cycle's golden ratio degree of freedom and the selloff from April into late May. Even more important, the golden ratio 61.8% extension of the ideal business cycle third, which is three Wall cycles and began on July 2, 2010, had the exact same ending target date as the Wall cycle from the October 4, 2011 low. This produced a double cycle time target in late May, which raised the odds of a Wall cycle turn.

Cycle time targets and their Fibonacci extensions are important. However, when they sync up with Fibonacci price targets, and when sentiment as measured with stochastics are signaling a possible cycle turn, investors and traders should pay close attention. That was occurring in late May and into the June low. Slight overshoot of the late May Fibonacci cycle targets took the market lower in early June. After a close on the exact 1310.33 Level 2 price target, a stunning and almost impossible feat, it plunged directly to the Level 2 38.2% target at 1278 for two closes. Price, time and sentiment in the cycles were indicating a turn was at hand. The downside trend and momentum was exhausted, and yes, central bank liquidity helped put in an artificial low and keep the manipulation premium intact, at least for now.
Looking at price, time and sentiment individually does not provide a great deal of confidence for investors and traders. However, when you combine them, you can increase your odds of identifying a high-probability turn in any market. Investing with a value or growth based approach can be improved by using an understanding of the cyclical forces at work, which are most accurately tracked using price, time and sentiment.
Of course, the entire point of investors and traders tracking the cycles is to increase alpha, risk-adjusted performance. There is more than enough risk to go around these days, so the more you can reduce it the better, especially when the risk is what almost everyone now recognizes to be systemic. To be clear, systemic means the entire global system is at risk. The market cycles over the next year, including the Wall cycle, business cycle and the long wave, promise to go down in the history books of market moves driven by human folly. Most market participants believe that the pavlovian primum purchased with debt is sustainable. They are wrong.
Just because the central banks of the world have bragging rights on recent business cycle higher lows, does not mean that this one will not be the one that gets away from them. When it does, the central bank manipulated 50% stock market cycle pavlovian premium will vanish into new cycle lows, punished by insolvency discounts.
Investors and traders must exercise patience and discipline. Once the pavlovian premium that is distorting the pricing mechanism of markets is wrung out of global stock markets, the next business cycle and long wave spring can get underway. A future is coming where investors and traders that stick to their discipline and proven methods are rewarded. Chasing bones tossed by central banks to insure the pavlovian premium is an increasingly dangerous game.
David Knox Barker is a long wave analyst, technical market analyst, world-systems analyst and author of Jubilee on Wall Street; An Optimistic Look at the Global Financial Crash, Updated and Expanded Edition (2009). He is the founder of LongWaveDynamics.com, and the publisher and editor of The Long Wave Dynamics Letter and the LWD Weekly Update Blog. Barker has studied and researched the Kondratieff long wave “Jubilee” cycle for over 25 years. He is one of the world’s foremost experts on the economic long wave. Barker was also founder and CEO for ten years from 1997 to 2007 of a successful life sciences research and marketing services company, serving a majority of the top 20 global life science companies. Barker holds a bachelor’s degree in finance and a master’s degree in political science. He enjoys reading, running and discussing big ideas with family and friends.
© 2012 Copyright David Knox Barker - All Rights Reserved Disclaimer: The above is a matter of opinion provided for general information purposes only and is not intended as investment advice. Information and analysis above are derived from sources and utilising methods believed to be reliable, but we cannot accept responsibility for any losses you may incur as a result of this analysis. Individuals should consult with their personal financial advisors.
© 2005-2022 http://www.MarketOracle.co.uk - The Market Oracle is a FREE Daily Financial Markets Analysis & Forecasting online publication.


