


Forecasting Future Earnings The Key to Stock Market Returns
InvestorEducation / Learning to Invest Jul 17, 2012 - 03:36 AM GMT

 In Part 1 and Part 2 of this three-part series, we established the basic principles of valuation and provided evidence that backs those principles up. Then we demonstrated that valuation is a function of soundness based on the current earnings yield that any given level of earnings offers you. From there, we illustrated how the future rate of earnings growth, in conjunction with fair valuation, will be the primary determinants of future returns.
A lot of what Part 1 and Part 2 were attempting to convey is the logical and common sense nature of valuation in regards to sensible stock investing. When the investor has a solid foundation of what real valuation is all about, they are less likely to be enticed into making bad decisions by an often emotionally-charged stock market. Therefore, extreme and anomalous market behavior can be recognized and dealt with accordingly. In other words, fear and greed can be controlled, thus paving the way for dialectic thinking.
Moreover, we tried to point out that valuation is about determining reasonable ranges of fair value. In other words, fair value is perhaps more a metaphor than a precise or absolute calculation. Furthermore, we demonstrated that a normal PE ratio of 15 represents a standard fair valuation for companies whose earnings growth rates range from 0% to 15%. Once again, the PE 15 is not necessarily a perfect number; instead, it indicates a sound valuation that represents an earnings yield of 6% to 7%.
Therefore, and for example, the difference between a PE valuation of 14, 15 or 16 is not that material to the long-term investor. Obviously, the lower the PE ratio you can purchase a company at the better. But the real value in considering valuation is the determination as to whether the investment makes economic sense and whether or not the risk taken is acceptable.
To put it another way, higher PE ratios indicate a significantly lower return on investment (earnings yield) than prudence would dictate. In the same vein, extremely low PE ratios would indicate great opportunity, assuming that earnings are not collapsing. Consequently, two points come logically into view: Aberrant PE ratios indicate valuation imbalances, and the necessity of forecasting future earnings growth is of high importance.
Forecasting Future Earnings - The Key
Once you have determined that fair valuation, plus or minus, exists, then the prudent investor should look to future earnings growth as the likely source of future long-term returns. Then, by applying the same principles that we presented and discussed in Parts 1 and 2, we can calculate within a reasonable range of predictability what our future returns might be.
There are several methods that can be used to forecast future earnings, however, we should always remember that these are forecasts and therefore, by their very nature, imperfect. Nevertheless, having a reasonable expectation of what future returns you can expect is a lot better than hope. Furthermore, once you have purchased a stock you can use this knowledge to make smarter and sounder future buy, sell or hold decisions. In other words, you can manage your portfolios more intelligently and effectively.
Extensive Comprehensive Research Effort
At the end of the day, there is no substitute for a comprehensive research effort and analysis. Even then, it would be naïve to expect perfection. However, the prudent investor should be capable of determining reasonable expectations that can be relied upon to make intelligent long-term investing decisions. However, it should never be forgotten that these decisions must be continuously monitored and kept up-to-date. Therefore, our first approach is to recommend a comprehensive research effort. For the sake of this article we once again rely on the F.A.S.T. Graphs™ research tool to facilitate this process.
In Part 1 and Part 2 we focused primarily on historical graphs that provided evidence supporting our thesis under real-world situations. Here in Part 3, we are going to move on by focusing on the Estimated Earnings and Return Calculator and the Earnings Yield Estimator. It’s important to realize that these tools are calculators that simply compute whatever data is fed into them. They also offer an override feature that allows the user to input their own estimates of their choosing, thereby generating their own forecasts.
Nonsubscribers to F.A.S.T. Graphs™ could utilize spreadsheets or other calculating tools in order to run their own numbers. However, the important point is that we believe that prudent long-term fundamental investors should be making these types of calculations. Because, we further believe that investors that have a realistic view of what their future returns may be, are better prepared to handle whatever challenges the marketplace may bring.
Estimating Future Earnings to Calculate Future Returns
For simplicity and space constraints, we are going to look at three sample companies to forecast future earnings growth and calculate future returns based on the standard 15 PE ratio. We will look at one that historically has grown at 5% or lower, one that is between 5% - 10%, and finally, one that is above 10% and approaching our 15% inflection point. Then we will offer a fourth and final sample that looks at growth above 15% where PEG ratio valuation comes into play.
Less Than 5% Growth - MGE Energy Inc (MGEE)
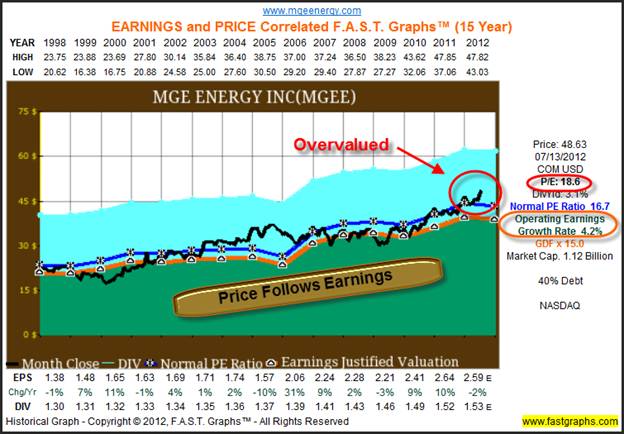
MGE Energy is a holding company based in Madison, Wisconsin. It is the parent company of the regulated utility Madison Gas and Electric Co. and other subsidiaries. The 15-year historical F.A.S.T. Graphs™ shows that the company’s earnings growth rate has been less than 5%. Moreover, we see the earnings and price relationship once again revealed. Clearly, this company has historically traded between our standard PE ratio of 15 and the company’s calculated normal PE ratio of 16.7. Most importantly, whenever it deviated from these fair valuation standards, price inevitably and quickly reverted to the mean.
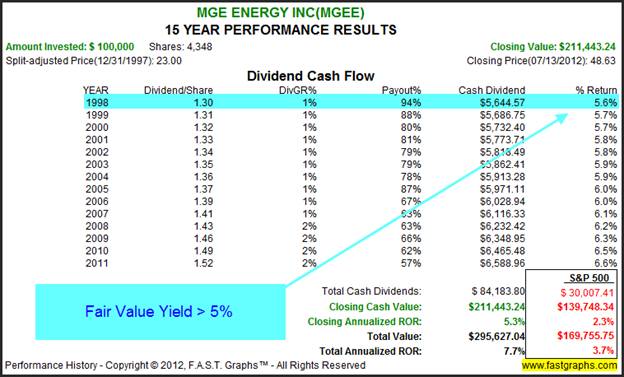
From a long-term performance point of view associated with the above earnings and price correlated graphic, we discover performance that correlates to earnings. However, the reader might note that the starting dividend yield in 1998 would have been 5.6%, which is materially higher than today’s 3.1%. This provides another good indicator of overvaluation.
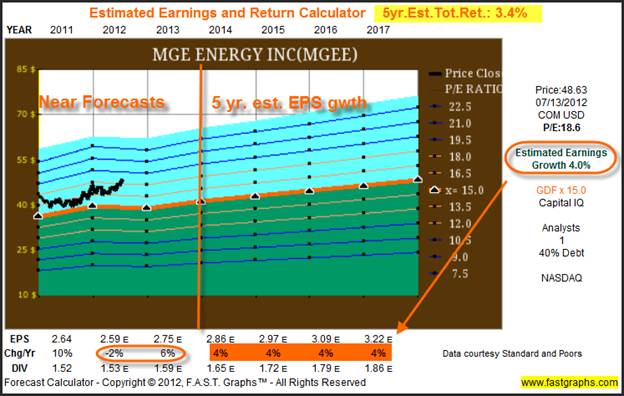
Although the forecasting graph (estimated earnings and return calculator) only shows one analyst forecasting future growth of 4%, it should be noted that this growth rate is also consistent with the company’s most recent five-year average. Consequently, given the long-term historical consistency of this regulated utility, a 4% growth rate seems plausible.
Note, for the reader to get the maximum benefit out of interpreting the forecasting charts, a few words of explanation are in order. The Estimated Earnings and Return Calculator provides both near and long-range forecasts. Specific earnings forecasts expressed in dollars are provided for the most current fiscal year and the next fiscal year. Then, the computer simply calculates future earnings beyond that point at the consensus five-year estimated growth rate, or the most recent five-year historical average.
Note that MGE Energy is currently trading at a PE ratio of 18.3 which is in excess of its historical normal 16.7 PE ratio and/or our standard PE ratio of 15. Consequently, the rational investor might expect that the future returns from investing in this high-quality utility at this high valuation could possibly limit and/or diminish long-term potential below-historical standards. Furthermore, the risk taken to earn this potentially lower than normal rate of return is higher than normal, or even what prudence would dictate.
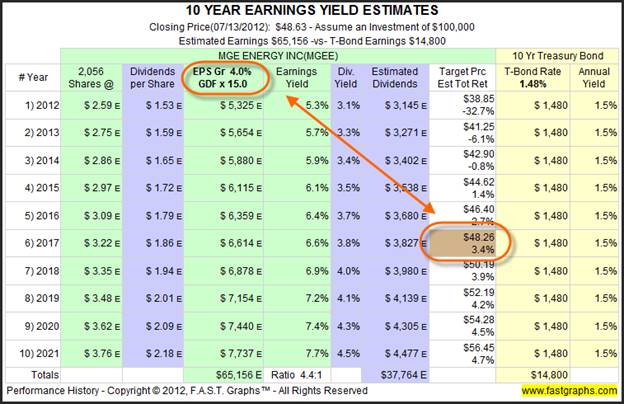
Currently, MGE Energy offers a 5.3% earnings yield, which is below our standard of 6.6% (100/15 PE) that a sounder PE ratio of 15 would provide. The bottom line is that MGE Energy does provide a potential compound annual rate of return of 3.4% (see yellow highlight in right hand corner of the graph) that is commensurate with its expected future operating growth; however, overvaluation indicates it might be less than historical norms.
Nevertheless, by utilizing the principles of valuation and earnings growth, investors can estimate, within a reasonable range of probability, the future returns on this company. Although this expectation may not be absolutely precise, it should become clear that it is certainly within the realm of reasonableness.
5% to 10% Growth - Stanley Black & Decker Inc (SWK)
Our next example, Stanley Black & Decker Inc., a diversified global provider of hand tools, power tools and related accessories moves a little further up the growth chain with a historical record of earnings growth of 7% per annum. There are a couple of interesting points to note on this historical graphic. First of all, the normal PE ratio (15.1) and the calculated fair value PE ratio (15) turn out to be virtually identical. Second, we see that every time stock price deviates from these norms either over or under, it quickly returns to fair value. Finally, note the overvaluation in 1998 versus undervaluation currently.
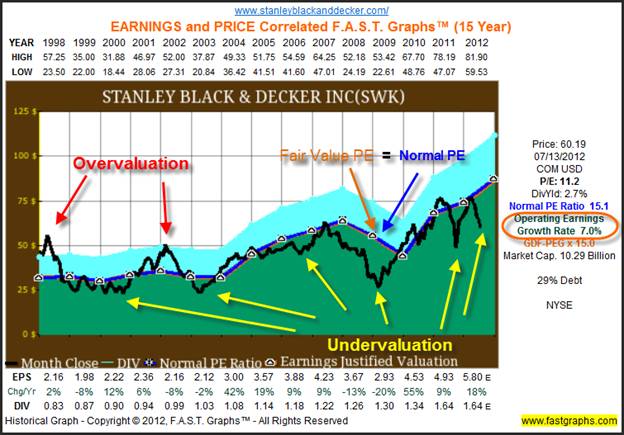
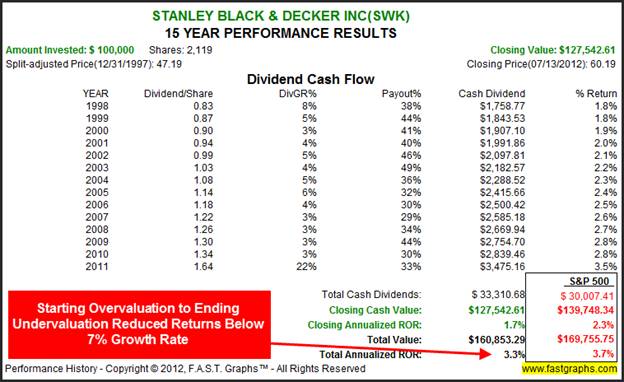
The key takeaway that the associated performance graph on Stanley Black & Decker illustrates is the undeniable effect of valuation discrepancies. Beginning overvaluation and ending undervaluation destroyed performance except for the contribution from dividend growth.
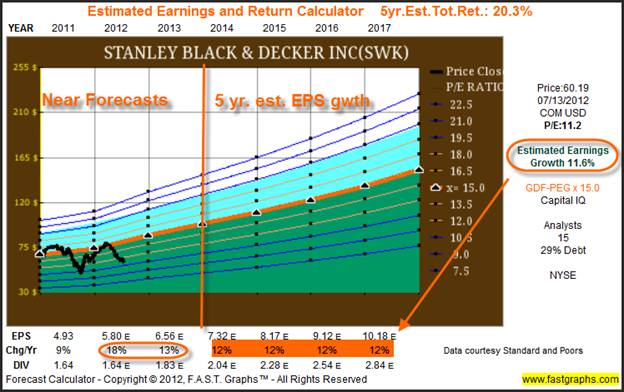
Due to the quasi cyclical nature of this company’s operating history, the consensus of 15 analysts expect five-year earnings growth to average 11.6%. However, they expect 18% earnings growth for this fiscal (calendar) year, followed by 13% growth for fiscal 2013 before averaging the 11.6% forecast (12% rounded). If the company is successful in achieving these forecasts, then a 20.3% compounded annual rate of return out to calendar year-end 2017 would be a reasonable expectation.
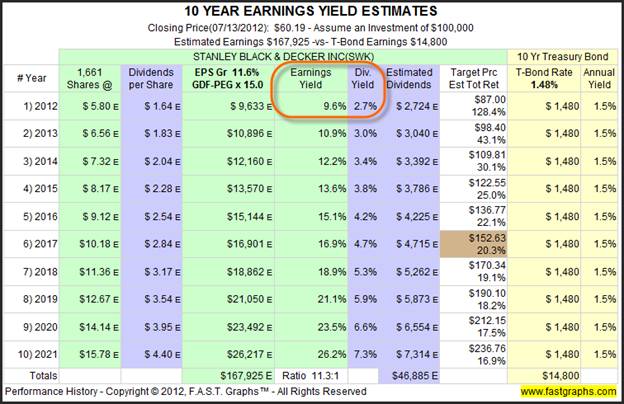
At today’s low valuation, Stanley Black & Decker offers a very strong and above-average earnings yield of 9.6%. Consequently, prospective investors are offered both a higher than normal capital appreciation potential, and a higher than normal starting current dividend yield.
On the other hand, and once again due to the quasi cyclical nature of this company’s operating history, the more prudent investor might want to calculate the future growth rate of this company at a more conservative level. The following Estimated Earnings and Return Calculator uses an override calculation of 7% estimated growth based on the company’s most recent five-year historical average earnings growth rate.
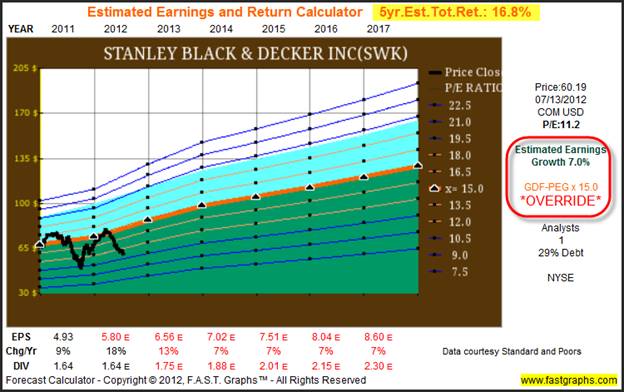
What is interesting about this next forecast, and what we believe the reader should recognize and understand, is that because we still calculate fair value at our standard PE ratio of 15, the company continues to offer an earnings yield of 9.6% even at the slower estimated growth rate. However, what is materially different is the future expectation of a total compounded annual return that drops from our previous expectation in excess of 20% to a lower estimate of 16.8%.
Perhaps the most interesting part of this is how low valuations can still provide excellent long-term returns even if earnings growth rates turn out to be lower than current forecasts. In other words, the prudent investors should realize that it is the combination of valuation coupled with earnings growth that ultimately delivers returns. Excessively high valuation can destroy future returns, while low valuations can enhance them.
10% - 15 % Growth- Union Pacific Corp (UNP)
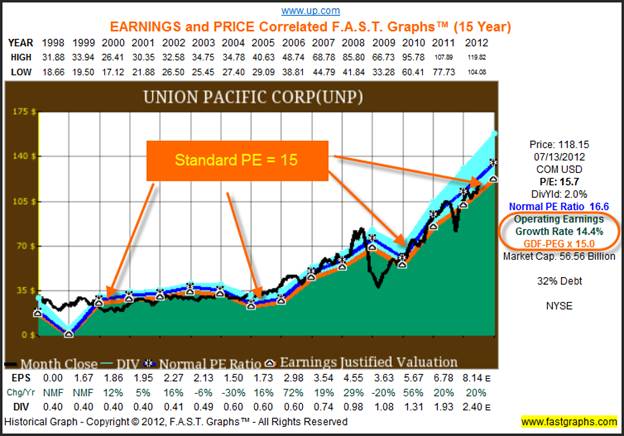
Union Pacific Corp., one of America’s leading railways, moves further up the growth chain as it approaches the 15% per annum earnings growth inflection point. The company’s historical operating earnings growth rate of 14.4% shows that even at this high rate of growth, the standard PE ratio of 15 continues to be relevant. Studying this earnings and price correlating graph validates the idea that it makes the most sense to invest in this company at a PE ratio of 15 or lower.
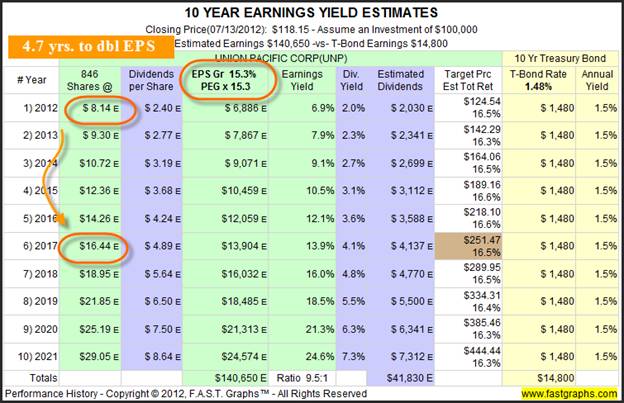
The consensus of 28 leading analysts expects Union Pacific Corp. to grow earnings at a rate of 20% through this fiscal year, followed by 14% next fiscal year. From fiscal year 2013 on, earnings are grown at the long-term consensus forecast of 15.3% per annum. Therefore, our long-term target return including dividends is expected to be 16.5%. Also, the reader should note that the formula used to calculate future fair valuation in this example is the PEG ratio (PE equal Growth rate).
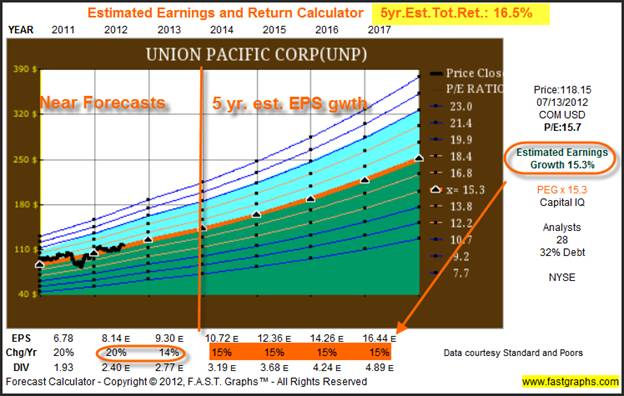
Union Pacific Corp. offers investors a current earnings yield of 7%. Furthermore, since the company currently trades at approximately fair value, our long-term target return expectation of 16.8% approximates earnings growth plus dividends.
As growth rates become higher and higher, the power of compounding becomes more and more of a factor. The key to understanding how much of a factor is to recognize that compounding is a function of how long it takes a number to double. Therefore, when you shorten the time it takes for a double to occur, the more doubles you can achieve over a longer term time frame.
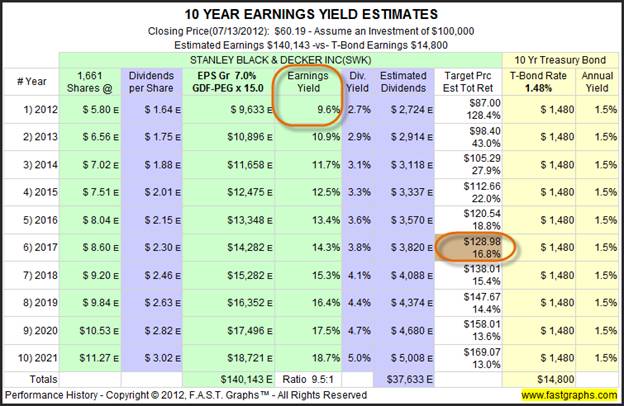
We use the Rule of 72 to calculate a rough estimate of how long it takes money to double at a given rate of return. Using our consensus 15.3% growth rate for Union Pacific Corp., we calculate that it will take approximately 4.7 years for a dollar’s worth of earnings to double. This doubling of earnings in the time it takes is calculated and circled on the following 10-year Earnings Yield Estimate table.
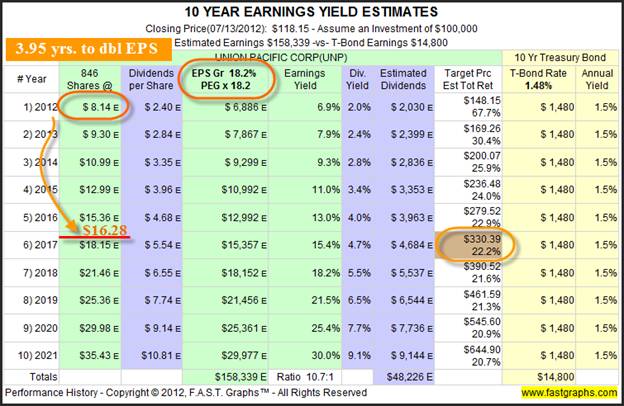
Interestingly, Union Pacific Corp.’s historical five-year average growth rate of 18.2% per annum is higher than its longer term 14.4%. Therefore, it seems logical that we might want to run a forecast utilizing the company’s more recent accelerated earnings growth. Utilizing a forecast of 18.2% growth expands our target return potential to 22.2% per annum. This further illustrates the mathematics and logic behind rational estimates of the rate of return opportunities possible utilizing different annual earnings growth rates.
Once again, utilizing the Rule of 72, we discover that it only takes approximately 3.95 years to double our earnings. In other words, we get our first doubling almost a year sooner at 18.2% than we do at 15.3%. (Later in the article we will provide a simple exercise that illustrates the dramatic results that getting a double sooner means to wealth generation).
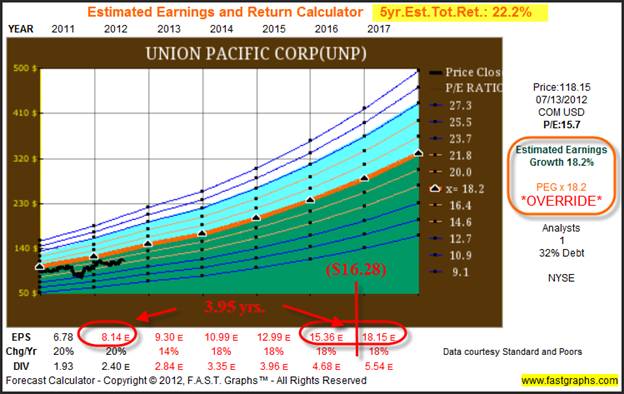
The important point here is that the company’s current PE ratio of 15.7 does not change; therefore, the company still offers a current earnings yield of 7%. The real difference is the accelerated future earnings growth rate that if it proved accurate, would indicate a higher future fair value PE ratio of 18.2 based on utilizing a PEG ratio formula for calculating fair value.
Fast Growth
One of the real keys to understanding how the compounding effect from faster growth influences valuation is to recognize the exponential nature of compounding. Since a faster growth rate shortens the time it takes a number to double, compounding needs to be thought of as geometric growth rather than arithmetic growth. The following simple exercise vividly illustrates the power and importance of compounding numbers:
In order to allow this exercise to be meaningful, we’re going to carefully select our parameters. First of all, we’re going to measure the effects of compounding over a 36-year period which we will call the hypothetical average working lifespan of an individual. Then we are going to compare what happens if we earned two precise hypothetical returns; 10% versus 20%.
If looked at with an arithmetic perspective it would be easy to erroneously assume that earning 20% over a lifetime would generate twice the amount of money that earning 10% over a lifetime would generate. However, doubling our rate of return cuts in half the time it takes our money to double and therefore, we get more doubles over our given time period. Therefore, the numbers look like this:
Utilizing the Rule of 72, we calculate that it takes 7.2 years (72 /10 = 7.2) to double our money at 10% growth. However, we learn that it only takes 3.6 years (72/20 = 3.6) to double our money at 20% growth. Since we chose to measure this over a 36-year period, we discover the following dynamics. If our money doubles every 7.2 years at 10% growth, we get 5 doubles of our money in 36 years (36/7.2 = 5). However, at 20% growth our money doubles every 3.6 years (36/3.6 = 10) giving us 10 doubles instead of 5. In other words, by doubling our rate of return we cut in half the time it takes our money to double and therefore get double the doubles.
The mathematics looks like this: $1.00 doubling 5 times at 10% growth over 36 years = $2.00, $4.00, $8.00, $16.00 and finally $32.00. However, at 20% growth we get 10 doubles, thereby adding 5 doubles over the same time frame, and the math looks like this as we double our dollar 5 additional times: $64.00, $128.00, $256.00, $512.00 and finally $1024.00. Therefore, earning 10% on our money over our 36-year lifetime turns every $1.00 we invest into $32.00. However, at 20% growth, we turn every $1.00 we invest into $1024 (32 X as much money) over our lifetime. This is the power of compounding and the effect it has on valuation.
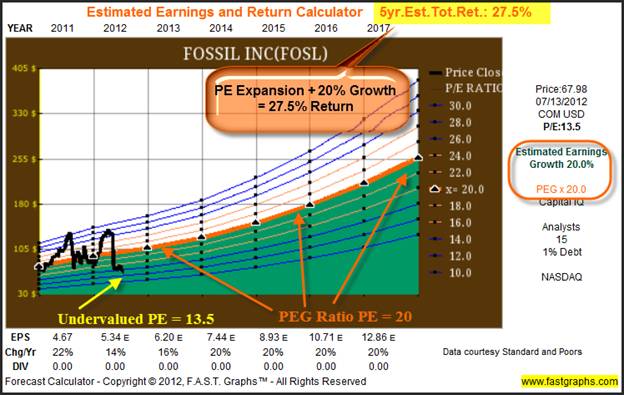
Above 15% Growth - Fossil Inc. (FOSL)
Fossil Inc. is an example of a company that has averaged over 20% annual earnings growth since 1998. Notice at the bottom of the graph that $0.46 of earnings in 1998 grew to $4.67 worth of earnings, or 10 times greater, by 2011. Compare this with some of the slower growth examples we used earlier, and the power of compounding at higher rates comes into clearer focus.
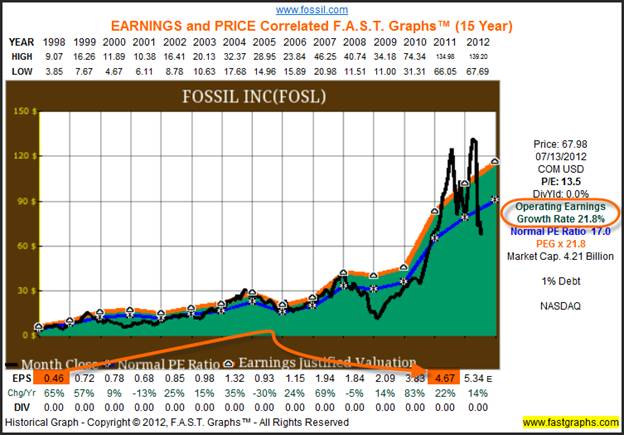
Since Fossil Inc. expected to average over 20% growth over the next 5 years, its theoretical value would imply a PE ratio of 20. Therefore, assuming it achieves the earnings growth estimates as expected, the current PE of 13.5 indicates that the company is undervalued. Consequently, the long-term rate of return expectation of 27.5% per annum implies a PE expansion plus earnings growth of 20% per annum.
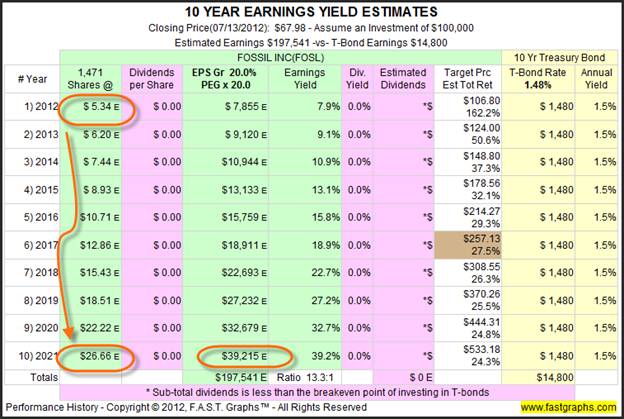
The following 10-year Earnings Yield Estimates table illustrates how the future value of this company might occur. If in fact it was capable of growing at 20% a year for the next 10 years, as it has over the past 15 years, then future earnings would grow from today’s $5.34 to $26.66 by 2021 (see circles on a 10-year earnings yield estimates table). The point being, that if this were to happen, then the market would have a significantly larger future income stream to capitalize than it does today. This would be the source of a much higher future valuation; again, assuming it occurs as forecast.
Summaries and Conclusion
This article, and the two that preceded it, were offered to present how to utilize the essence of valuation coupled with earnings growth to determine returns on your common stocks. At its core, fair valuation implies a valuation level or price where the company’s cash flows (earnings) represent a reasonable and achievable return on investment. In other words, is the company making its owners enough money to be considered an attractive investment.
It’s vitally important to understand that stock markets are not always efficient, as many scholars try to lead us to believe. Stock prices can, will, and do deviate, sometimes dramatically so, from fair value. However, it is our experience and observation over many decades, that fair valuation will inevitably revert to its mean when aberrant values exist. Therefore, recognizing when either extreme overvaluation or undervaluation is manifest empowers investors to make smarter and certainly sounder long-term decisions.
The principles presented in this series are most relevant to long-term serious investors. Shorter-term oriented traders may not find these principles of much use. On the other hand, we question whether or not short-term traders can truly find any principles that are of much practical use over the longer run.
The logic supporting these statements are that forecasting business results can be done within a reasonable amount of accuracy. On the other hand, forecasting the short-term gyrations of an often emotionally charged marketplace are impossible, other than by mere chance. This is because these gyrations are often emotionally driven, and therefore, illogical by their very nature.
Finally, we believe that if more people were focused on, and understood the mathematical principles and realities that underpin sound valuation, then unsettling price volatility would diminish. People would still debate what precise forecast growth rate should be applied to a given company. Differences in these forecasts would create differences in the long-term return expectations.
However, differences in current valuation, given the reality of a normal PE ratio based on earnings yield, would keep stocks reasonably priced. Therefore,investing would become less speculative and market gyrations more calm. Stockmarkets would function better, and investors would have more confidence and be more capable of better long-term strategic planning for their retirements.
Disclosure: No positions at the time of writing.By Chuck Carnevale
Charles (Chuck) C. Carnevale is the creator of F.A.S.T. Graphs™. Chuck is also co-founder of an investment management firm. He has been working in the securities industry since 1970: he has been a partner with a private NYSE member firm, the President of a NASD firm, Vice President and Regional Marketing Director for a major AMEX listed company, and an Associate Vice President and Investment Consulting Services Coordinator for a major NYSE member firm.
Prior to forming his own investment firm, he was a partner in a 30-year-old established registered investment advisory in Tampa, Florida. Chuck holds a Bachelor of Science in Economics and Finance from the University of Tampa. Chuck is a sought-after public speaker who is very passionate about spreading the critical message of prudence in money management. Chuck is a Veteran of the Vietnam War and was awarded both the Bronze Star and the Vietnam Honor Medal.
© 2012 Copyright Charles (Chuck) C. Carnevale - All Rights Reserved Disclaimer: The above is a matter of opinion provided for general information purposes only and is not intended as investment advice. Information and analysis above are derived from sources and utilising methods believed to be reliable, but we cannot accept responsibility for any losses you may incur as a result of this analysis. Individuals should consult with their personal financial advisors.
© 2005-2022 http://www.MarketOracle.co.uk - The Market Oracle is a FREE Daily Financial Markets Analysis & Forecasting online publication.