Using Options to Trade Apple AAPL Corporate Earnings News
Companies / Options & Warrants Jul 23, 2012 - 02:14 PM GMTBy: J_W_Jones
 Trading stock around the times of earnings releases is a notoriously difficult operation because it requires accurate prediction of the direction of price movement. Wrong predictions can expose the trader to substantial loss if large unexpected moves occur against his position.
Because of the risk associated with these events, many traders use options to define their risk and protect their trading capital. The purpose of my missive today is to present several approaches to using options to capture profits during the earnings cycle and to help present the logic and call attention to a major potential pitfall of using these vehicles in this specific situation.
It is essential to recognize that as earnings announcements approach, there is a consistent and predictable pattern of increase in the implied volatility of options. This juiced implied volatility reliably collapses toward historical averages following release of earnings and the resulting price move.
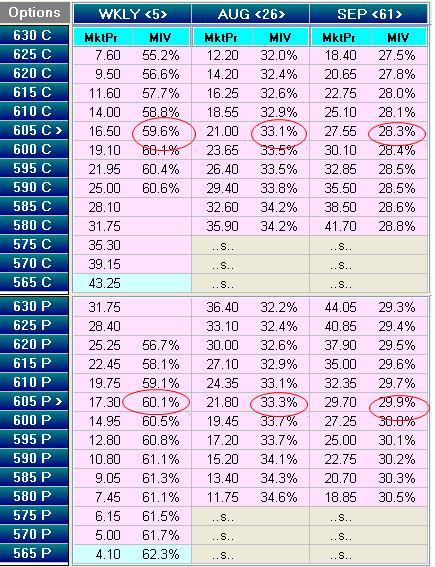
A real world example of this phenomenon can be seen in the options chain of AAPL which will report earnings tomorrow afternoon. The current options quotes are displayed in the table below:

AAPL Option Trade
Notice the implied volatility labeled as MIV in the table above for the 605 strike call. The volatility for the front series, the weekly contract, is 59.6% whereas that same option in the September monthly series carries a volatility of 28.3%.
This is a huge difference and has a major impact on option pricing. If the weekly carried the same implied volatility as the September option, it would be priced at around $7.70 rather than its current price of $16.50!
The value of the implied volatility in the front month options or front week options allows calculation of the predicted move of the underlying but is silent on the direction of the move. A variety of formulas to calculate the magnitude of this move are available, but the simplest is perhaps the average of the price of the front series strangle and straddle.
In the case of AAPL, the straddle is priced at $33.80 and the first out-of-the-money strangle is priced at $28.95. So the option pricing is predicting a move of around $31.50. This analysis gives no information whatsoever on the probability of the direction of the move.
There are a large number of potential trades that could be entered to profit from the price reaction to earnings. The only bad trades are ones that will be negatively impacted by the predictable collapse in implied volatility.
An example of a poor trade ahead of earnings would be simply buying long puts or long calls. This trade construction will face a strong price headwind as implied volatility returns toward its normal range after release of the earnings.
Let us look at simple examples of a bullish trade, a bearish trade, and a trade that reflects a different approach. The core logic in constructing these trades is that they must be at the least minimally impacted by decreases in implied volatility (in optionspeak, the vega must be small) and even better they are positively impacted by decreases in implied volatility (negative vega trades).
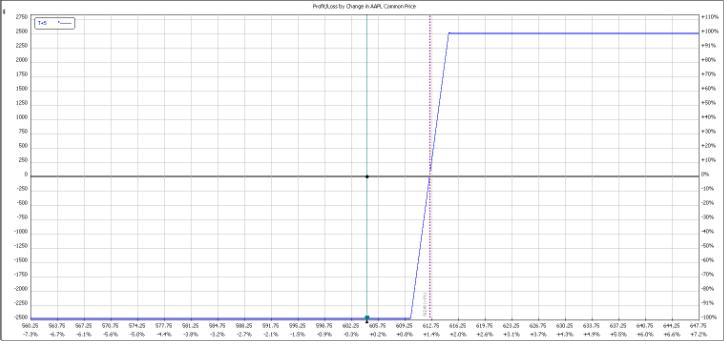
The bullish trade is a call debit spread and the P&L is graphed below:

Bullish AAPL Option Strategy
This trade has maximum defined risk of the cost to establish the trade, a small negative exposure to decreasing implied volatility, and reaches maximum profitability at expiration when AAPL is at $615 or higher.
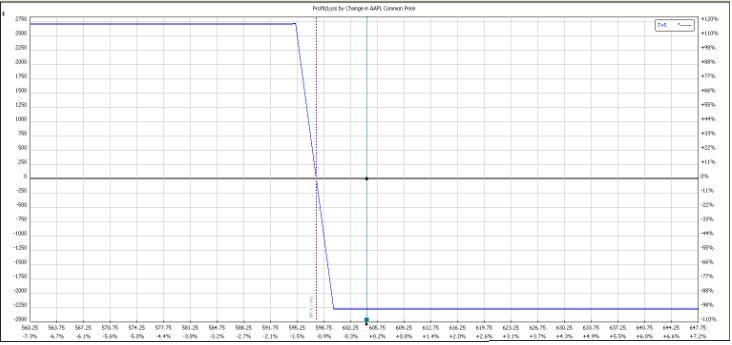
The bearish trade is a put debit spread and the P&L is shown below:

Bearish AAPL Option Strategy
Its functional characteristics are similar to the call debit and it reaches maximum profitability at expiration when AAPL is at $595 or lower.
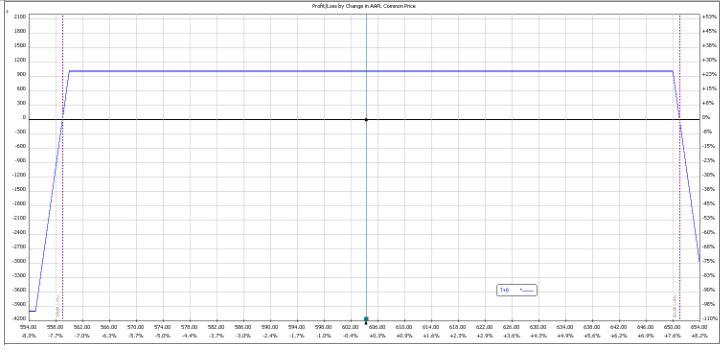
And finally the different approach, a trade called an Iron Condor, with a broad range of profitability. The Iron Condor Spread reflects the expectation that AAPL will move no more than 1.5 times (1.5x) the predicted move: Click to ENLARGE

Apple – AAPL Option Iron Condor Spread
This trade has significantly less potential profit than the directional trades but it does not require accurate prognostication of the price direction related to the earnings release. It is profitable as long as AAPL closes between $551 and $651 at expiration. This is an example of a “negative vega” trade which profits from the collapse of implied volatility.
These are but three examples of a multitude of potential trades to capture profit around AAPL’s earnings cycle. These same trade constructions and rules apply to any underlying ahead of a major earnings release, economic data release, or FDA announcement where one or a small group of underlying assets are significantly impacted.
Within each of these groups, there are multiple potential specific constructions of strike price combinations that can be optimized to reflect a wide range of price hypothesis.
In next week’s column, we will return to this intriguing topic of trading options around earnings and see how our example trades performed. Until then,
Happy Option Trading!
 If you are looking for a simple one trade per week trading style then be sure to join www.OptionsTradingSignals.com today with our 14 Day Trial.
J.W. Jones is an independent options trader using multiple forms of analysis to guide his option trading strategies. Jones has an extensive background in portfolio analysis and analytics as well as risk analysis. J.W. strives to reach traders that are missing opportunities trading options and commits to writing content which is not only educational, but entertaining as well. Regular readers will develop the knowledge and skills to trade options competently over time. Jones focuses on writing spreads in situations where risk is clearly defined and high potential returns can be realized.
This article is intended solely for information purposes. The opinions are those of the author only. Please conduct further research and consult your financial advisor before making any investment/trading decision. No responsibility can be accepted for losses that may result as a consequence of trading on the basis of this analysis.
© 2005-2022 http://www.MarketOracle.co.uk - The Market Oracle is a FREE Daily Financial Markets Analysis & Forecasting online publication.


