


Horse-Whipping Interest Rates to Zero
Interest-Rates / US Interest Rates Jul 25, 2012 - 01:43 PM GMTBy: Rob_Kirby

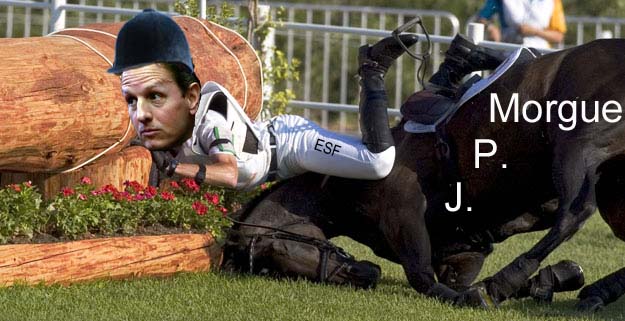
 Note how we barely see the hand of the ‘mystery’ rider [Geithner]. Note the conduit [crop] through which the force is applied. Now note the animal that does the heavy lifting…
Interest Rate Swaps and the Long End of the Interest Rate Curve
The rest of the world has been a net seller of U.S. Treasuries for a number of years now. It has been the U.S. Treasury – exercising / implementing Imperialist U.S. monetary policy through the trading desks of the magnificent five [J.P. M., BofA, Citi, Goldy and MS] – IN THE LONG END OF THE INTEREST RATE CURVE by selling tens upon tens of Trillions of Interest Rate Swaps [IRS] – deals between the banks [payers of fixed] with the Exchange Stabilization Fund [ESF] brokered by the N.Y. Fed trading desk. This is what has kept things “appearing somewhat normal” in the long end of the interest rate curve.
Forward Rate Agreements [FRA’s] and the Short End of the Curve
Getting banks to purchase U.S. Government paper in the short end of the interest rate curve [< 1 yr.] – creating the cascades in T-Bill rates depicted in C and D below – is not solely the product of lowering the Fed Funds [over-night] rate – and requires a different tact:
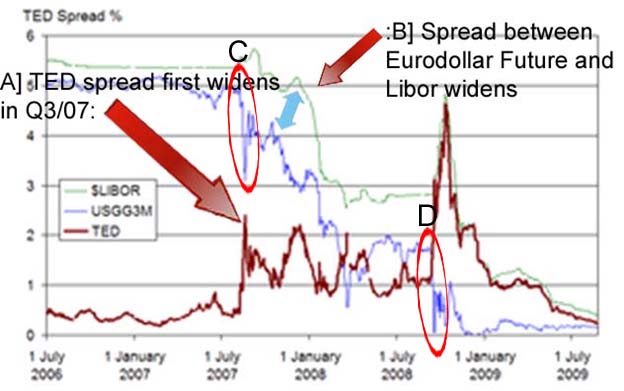
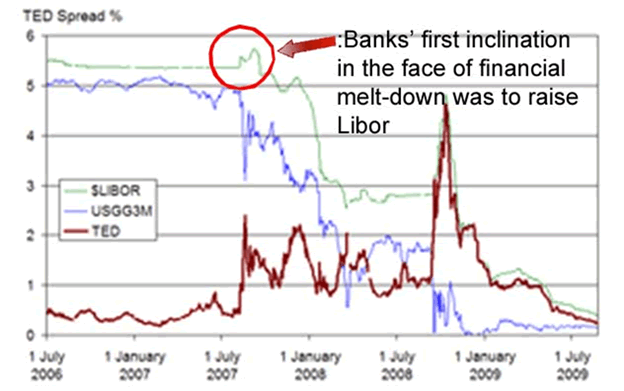
Zeroing in on “C” above, we can see how Government T-Bill yields plunged down in Q3/07 EVEN AS BANKS initial reaction was to RAISE Libor rates:
So, the plunge in rates was CLEARLY NOT INTER-BANK TRADING INDUCED – higher Libor rates means that banks think rates are going higher. So what, or who, caused the plunge in short term rates????
We find the answer to this question when we analyze the composition of J.P. Morgan’s derivatives book [particularly the OTC Swap component of their book] from a control period Q2/07 through Q3/07 and on to Q4/07:
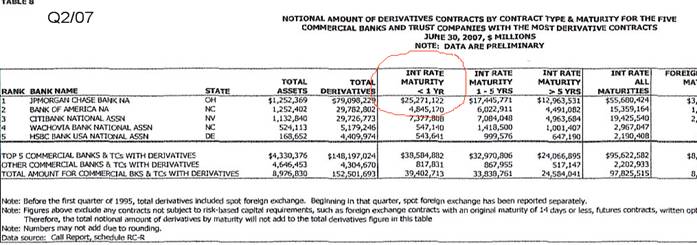
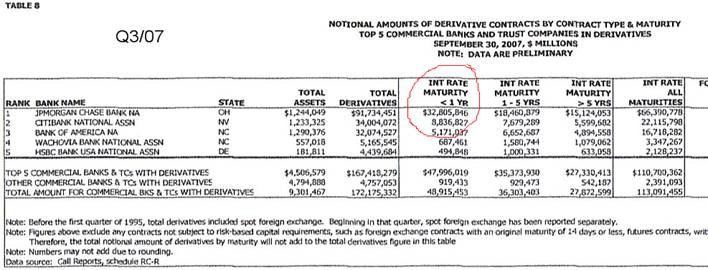
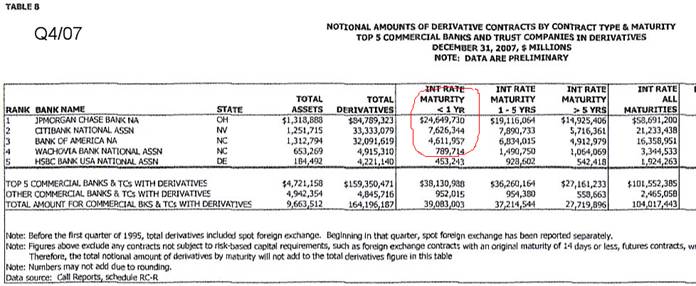
Here we see the less than 1 year Swap component of Morgan’s book grow from 25.2 Trillion in Q2/07 to 32.8 Trillion in Q3/07 before reverting back to 24.7 Trillion in Q4/07. Morgan’s < than 1 yr. OTC Swap component of their derivatives book BLOATED by 7.5 Trillion - an insidious disgrace - in Q3/07 before recoiling back in Q4/07. Here’s how that happened:
The less than 1 yr. component of a derivatives book INCLUDES instruments known as FRA’s which “settle” against 3 and 6 month U.S. Dollar Libor. OTC FRA contracts are all tailor made between counterparties and like IRS – they require two-way credit lines between counterparties.
Near term 3 month FRA’s would be described as:
- 0 x 3 FRA over a specified date in the current month [basically a bet on what 3 month Libor will be on a specific date before the current month ends.
- 1 x 4 FRA would be a bet – between two counterparties – on what 3 month Libor will be at a specific date in the next calendar month.
- 2 x 5 FRA would be a bet – between two counterparties – on what 3 month Libor will be at a specific date two months from now
The same thing applies with six month FRA’s:
- 0 x 6 FRA over a specified date in the current month [basically a bet on what 6 month Libor will be on a specific date before the current month ends…
- 1 x 7 FRA would be a bet – between two counterparties – on what 6 month Libor will be at a specific date in the next calendar month.
- Etc…
What happened in 2007 and 2008 is that the ESF acting through the N.Y. Fed trading desk – had Fed traders call J.P. Morgan’s trading desk and ask them where they “pay” for hundreds-upon-hundreds of billions [totalling Trillions] worth of these 0 x 3, 1 x 4, 2 x 5, 0 x 6, 1 x 7 etc… When Morgan posted their prices their bids were “hit” NECESSITATING them to immediately “hedge” or purchase ungodly amounts of U.S. 3 and 6 month T-bills.
The beauty of this type of operation, from the Treasury/Fed point of view – is that these trades HORSE-WHIP short term rates LOWER in a hurry, make the U.S. Dollar look strong and they mature within 3 months [the FRA’s settle vs. Libor and the T-bills mature at par]. This is the only reason WHY J.P. Morgan’s derivatives book could “bloat” and then “recoil” to the tune of 7.5 Trillion in a 3 month time period. The bad part – they leave a “paper trail” – which exposes what they did - in the Office of the Comptroller of the Currency quarterly derivatives reports.
One of the side-effects of this INTERVENTION on the part of the U.S. Treasury’s ESF – is that Libor “appeared” to BREAK DOWN. The reason for the apparent break-down in Libor was that the U.S. Treasury was trying to fix a problem of “insolvency” [caused by too much debt] with massive additions of “liquidity” [more debt].
The same process occurred in 2008 when short term rates once again plunged from approximately 2.00 % to ZERO. This time a roughly 8 Trillion “bloat” showed up in Morgan’s < 1 yr. swap book – but not until Q1/09 – and has, more-or-less, remained at this elevated level to this day.
Banks like Barclays initially recognized the problem in the financial system as being an issue of insolvency – and hence started raising rates to conserve/preserve capital. This put them “at odds” with the ESF [via the Fed and J.P.M.] intervention making “Libor” appear broken – as expressed by the dramatic widening of the TED spread.
The problem[s] with Libor are not Barclays or Bank of England centric. This is an American [U.S. Treasury], Fed and a J.P. Morgan centric issue. This is why no one from officialdom will DARE speak about the size and composition of derivatives books like J.P. Morgan [70 Trillion] et al – regularly making “adds” in given quarters of 10+ Trillion in the “swap” components of their books.
Ladies and gentlemen, the ENTIRE interest rate curve has been horse-whipped to ZERO. This has been done in the name of U.S. national security, preservation of the global U.S. Dollar Standard, bailing out insolvent banks and at the expense of savers, pensions, pensioners and the capital stock.
And in case any of you are left wondering how captive banks with MONSTER derivatives books REALLY make their dough – it’s mainly because they have privileged insider information they glean [can you say front-run?] from being the “go to” horses of the horse-whipping elite. Trading treasury bonds and T-bills profitably isn’t really that difficult when you know in advance which way interest rates are going.
And we’ve all been horse-bleeped into thinking it was because they were the brightest and the best.
What a let-down [or trip-up, perhaps?].
Happy trails!
Got physical gold yet?
By Rob Kirby
http://www.kirbyanalytics.com/
Rob Kirby is proprietor of Kirbyanalytics.com and sales agent for Bullion Custodial Services. Subscribers to the Kirbyanalytics newsletter can look forward to a weekend publication analyzing many recent global geo-political events and more. Subscribe to Kirbyanalytics news letter here. Buy physical gold, silver or platinum bullion here.
Copyright © 2012 Rob Kirby - All rights reserved.
Disclaimer: The above is a matter of opinion provided for general information purposes only and is not intended as investment advice. Information and analysis above are derived from sources and utilising methods believed to be reliable, but we cannot accept responsibility for any trading losses you may incur as a result of this analysis. Individuals should consult with their personal financial advisors before engaging in any trading activities.
Rob Kirby Archive |
© 2005-2022 http://www.MarketOracle.co.uk - The Market Oracle is a FREE Daily Financial Markets Analysis & Forecasting online publication.