Short-term Upside in S&P 500 & Nasdaq Stock Market Indices
Stock-Markets / US Stock Markets Feb 02, 2008 - 03:39 PM GMTBy: Mike_Paulenoff
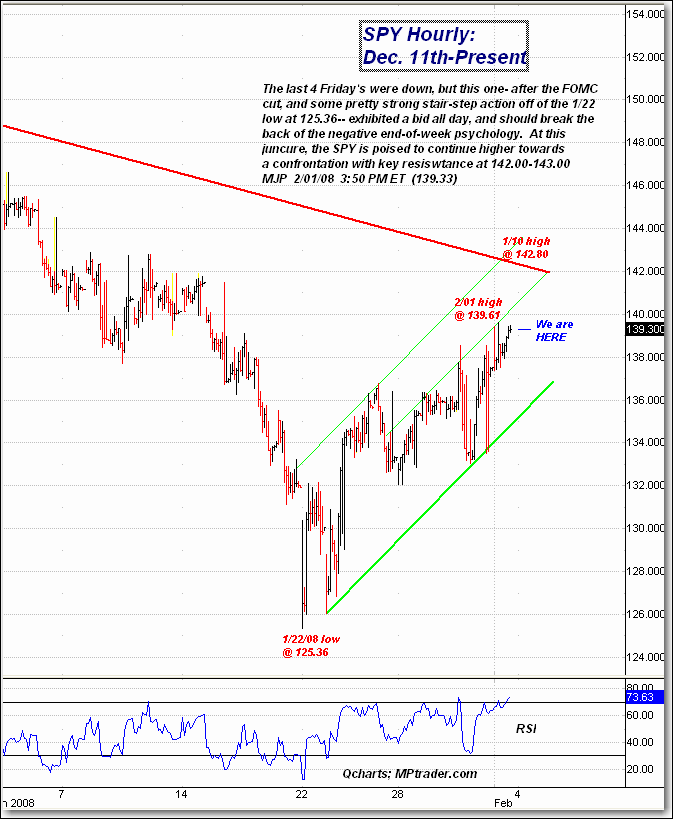
 This week we're looking at some short-term patterns for trading this volatile market, starting with the hourly chart on the S&P 500 Depository Receipts (SPY), as of just before Friday's close.
The last four Friday's were down, but this one -- after the FOMC cut and some pretty strong stair-step action off of the 1/22 low at 125.36 -- exhibited a bid all day, and should break the back of the negative end-of-week psychology. At this juncture, the SPY is poised to continue higher towards a confrontation with key resistance at 142.00-143.00.

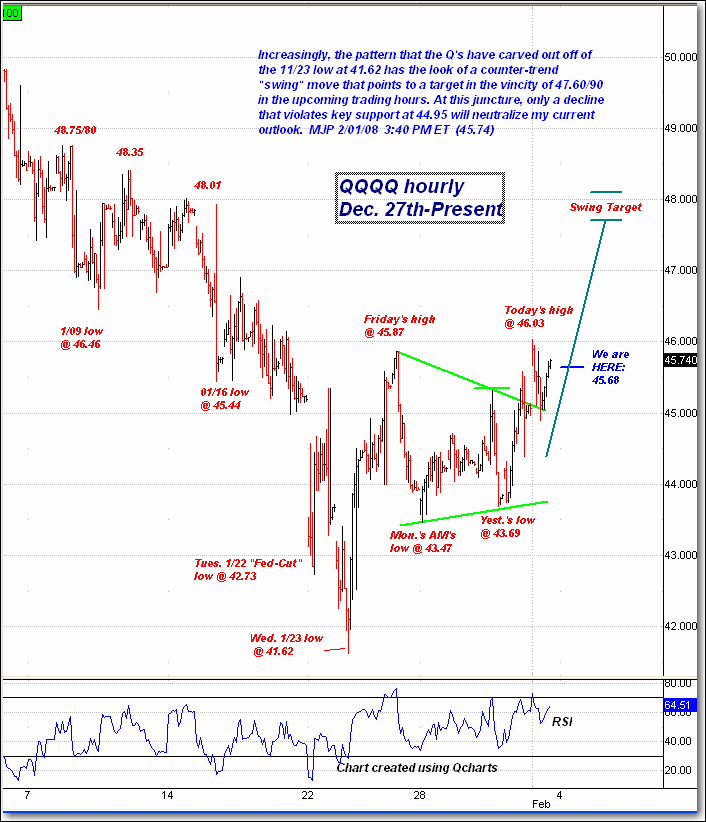
Moving over to the Nasdaq, increasingly the pattern that the Q's (QQQQ) have carved out off of the 11/23 low at 41.62 has the look of a countertrend "swing" move that points to a target in the vicinity of 47.60-.90 in the upcoming trading hours. At this juncture only a decline that violates key support at 44.95 will neutralize my current outlook.

Sign up for a free 15-day trial to Mike's ETF Trading Diary today.
By Mike Paulenoff
Mike Paulenoff is author of the MPTrader.com (www.mptrader.com) , a real-time diary of Mike Paulenoff's trading ideas and technical chart analysis of Exchange Traded Funds (ETFs) that track equity indices, metals, energy commodities, currencies, Treasuries, and other markets. It is for traders with a 3-30 day time horizon, who use the service for guidance on both specific trades as well as general market direction
© 2002-2008 MPTrader.com, an AdviceTrade publication. All rights reserved. Any publication, distribution, retransmission or reproduction of information or data contained on this Web site without written consent from MPTrader is prohibited. See our disclaimer.
Mike Paulenoff Archive |
© 2005-2022 http://www.MarketOracle.co.uk - The Market Oracle is a FREE Daily Financial Markets Analysis & Forecasting online publication.


