U.S. Heat Wave Won't Propell Natural Gas to $8 in 2012
Commodities / Natural Gas Aug 01, 2012 - 03:58 AM GMTBy: EconMatters
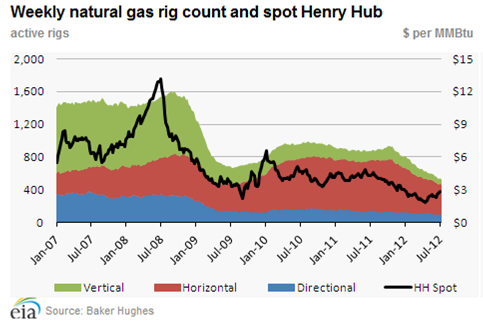
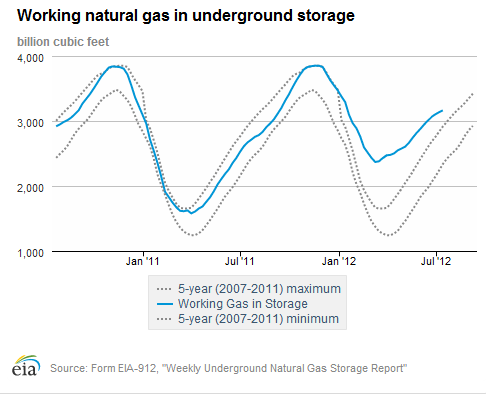
 The Energy Department reported that natural gas in storage grew by 26 billion cubic feet to 3.189 trillion cubic feet for the week ended July 20. The inventory level was 15.8% above the five-year average of 2.754 trillion cubic feet, and 18% above last year's level. Low natural gas prices in the U.S. this year has not only tanked the stocks of many gas-weighted producers, but also dragged down profits of U.S-based oilfield services companies as a result of reduced gas drilling activity (See Chart Below). However, since hitting a 10-year low of below $2/mmbtu in April, Henry Hub benchmark prices has surged 69% hitting $3.214/mmbtu on Monday, July 30, the high of the year.

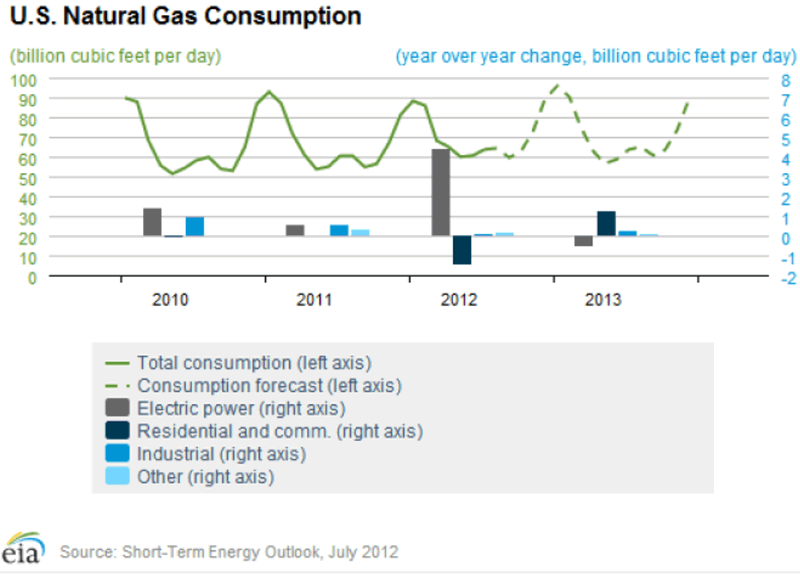
The latest bullish sentiment is fueled mostly by forecasts for more unusual heat this summer to increase air conditioning use. In addition, there's also an increase in usage/demand as lower natural gas prices have also attracted many utilities to switch from coal to natural gas for power generation. According to the EIA, electricity generated using natural gas was roughly even with coal for the first time ever in April. Historically, natural gas typically supplied just over 20% of the domestic electricity needs. These positive indicators have prompted at least one article at Forbes to predict $8.00/mcf natural gas by "the approaching winter"--that means another 160% rise in about four months. Well, EIA did raise its estimate for domestic natural gas consumption this year, expecting demand to climb 3.3 bcfd, or 4.9%, from 2011 to 69.91 bcf daily driven mainly by a 21% jump in utilities coal-to-gas switching for power generation in 2012, offsetting declines in residential and commercial use, primarily due to a weak U.S. economy.

Nevertheless, the problem is natural gas starts to lose its cost advantage to coal at around $2.40 to $2.50 per mmbtu. So the current $3.20/mmbtu levels, if sustained, could take away one significant bullish swing factor in the natural gas fundamentals--demand from the power gen sector. If that happens, it is very likely there could be another record storage level before "the approaching winter," let alone $8/mmbtu.

The natural-gas market this year is now outpacing even the returns in oil and copper (i.e. Every dog has its day). However, our observation is that the NYMEX natural gas market a lot of times could be in a somewhat irrational "trend-trading" mode driven mostly by traders totally disregarding the fundamentals. The current run-up seems to be in one of those "trend-trading" momentum, and likely will not last long after reality sets in. For now, we see Henry Hub continue to hover within the $2-$3/mmbtu range in the next twelve months barring a super-sized hurricane knocking out production in the U.S. Gulf.
By EconMatters
The theory of quantum mechanics and Einstein’s theory of relativity (E=mc2) have taught us that matter (yin) and energy (yang) are inter-related and interdependent. This interconnectness of all things is the essense of the concept “yin-yang”, and Einstein’s fundamental equation: matter equals energy. The same theories may be applied to equities and commodity markets.
All things within the markets and macro-economy undergo constant change and transformation, and everything is interconnected. That’s why here at Economic Forecasts & Opinions, we focus on identifying the fundamental theories of cause and effect in the markets to help you achieve a great continuum of portfolio yin-yang equilibrium.
That's why, with a team of analysts, we at EconMatters focus on identifying the fundamental theories of cause and effect in the financial markets that matters to your portfolio.
© 2012 Copyright EconMatters - All Rights Reserved Disclaimer: The above is a matter of opinion provided for general information purposes only and is not intended as investment advice. Information and analysis above are derived from sources and utilising methods believed to be reliable, but we cannot accept responsibility for any losses you may incur as a result of this analysis. Individuals should consult with their personal financial advisors.
© 2005-2022 http://www.MarketOracle.co.uk - The Market Oracle is a FREE Daily Financial Markets Analysis & Forecasting online publication.


