Silver Suffers The Most From Bernanke, What's Next?
Commodities / Gold and Silver 2012 Aug 02, 2012 - 04:55 AM GMTBy: Chris_Vermeulen
 While the exchange traded funds for gold (NYSEARCA: GLD TRADING - GLD QUOTE) and copper (NYSEARCA: JJC) fell today due to investors expressing disappoint at the modest response of the Federal Reserve to declining economic growth, it was silver (NYSEARCA: SLV Trading, SLV Quote) that was off the most.
SPDR Gold Shares (GLD) fell in trading today by 0.89%. IPath Dow Jones Copper (JJC) dropped 1.89%. Plunging the deepest was iShares Silver Trust (SLV), off by 2.14%.
Traders were hoping for more aggressive action by Federal Reserve Chairman Ben Bernanke. But that will not come until after the November elections in the United States. Remember that Quantitative Easing 2 did not begin until November 2010, though it was announced at the Jackson Hole economic policy summit in August of 2010.
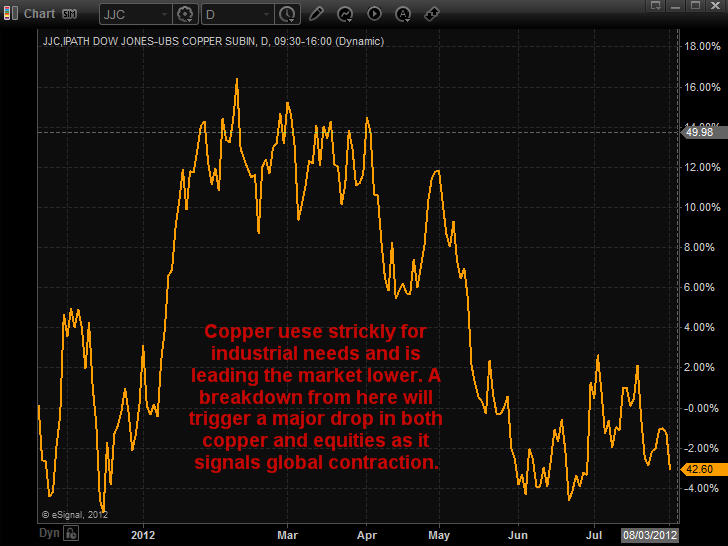
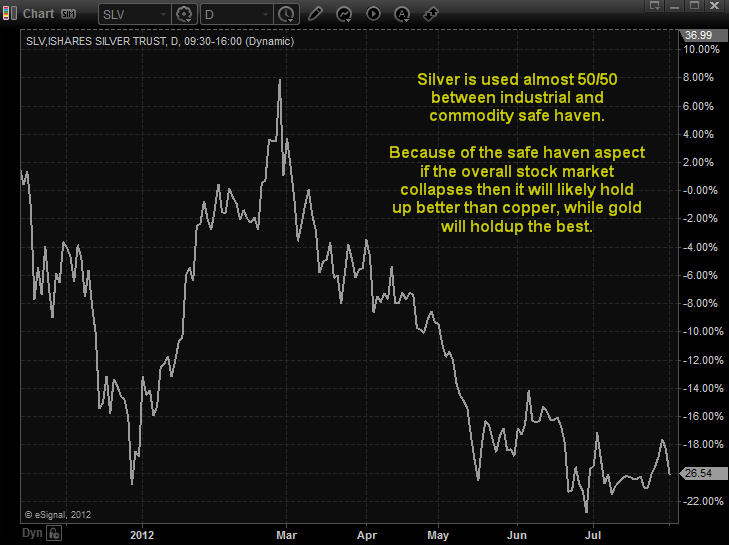
Silver is in what would seem to be the “sweet spot” between gold and copper. Almost all of gold is used for investment or decorative purposes. Almost all of The Red Metal goes for industrial needs. For silver, it comes almost down right in the middle between commercial and a commodity for investments or jewelry. The charts below show the trading relationship for each of the exchange traded funds when paired against each other.

JJC Copper ETF Trading
Even though silver has a much higher industrial usage, the SLV moves along with the GLD. As a result, it soared during Quantitative Easing 2. Obviously, the charts reveal that most of the trading is from speculators as the JJC should move in an inverse relationship with the GLD. That is due to gold being used almost entirely for non-industrial end uses while copper is used almost industrial for industrial uses.
Up slightly for the week as traders thought more dramatic economic stimulus efforts would result from the Federal Open Market Committee meeting other than an extension until the end of the year for Operation Twist, the SLV is down for the last month, quarter, six months and 52 weeks of market action. Year to date, the SLV is off by 1.48%.
For the last year, however, the SLV is down 33.35%. Volume was up today, with the SLV below its 20-day, 50-day and 200-day moving averages. In the most obvious trend, it is trading much lower under its 200-day day moving average at 11.67% down than underneath the 20-day moving average, beneath it by only 0.17%. The only move worth noting in the technical indicators for silver were the long engulfing green bodies last week after Treasury Secretary Geithner’s gloomy testimony on The Hill and more bad economic news from the US peaked buying as traders thought Quantitative Easing 3 was coming.

SLV ETF Trading
If traders long on silver are looking for help from Bernanke, it will not be coming until after the November election, though it could be announced when he speaks later this month at Jackson Hole.
If you would like to receive my free weekly analysis like this, be sure to opt-in to my list: http://www.thegoldandoilguy.com/free-preview.php
By Chris Vermeulen
Chris@TheGoldAndOilGuy.com
Please visit my website for more information. http://www.TheGoldAndOilGuy.com
Chris Vermeulen is Founder of the popular trading site TheGoldAndOilGuy.com. There he shares his highly successful, low-risk trading method. For 6 years Chris has been a leader in teaching others to skillfully trade in gold, oil, and silver in both bull and bear markets. Subscribers to his service depend on Chris' uniquely consistent investment opportunities that carry exceptionally low risk and high return.
This article is intended solely for information purposes. The opinions are those of the author only. Please conduct further research and consult your financial advisor before making any investment/trading decision. No responsibility can be accepted for losses that may result as a consequence of trading on the basis of this analysis.
© 2005-2022 http://www.MarketOracle.co.uk - The Market Oracle is a FREE Daily Financial Markets Analysis & Forecasting online publication.


