


Using Volatility to Trade IBM Stock Options
Companies / Options & Warrants Aug 09, 2012 - 02:35 AM GMTBy: J_W_Jones

 One of the hallmarks of an option based trading approach is the ability to accommodate various market conditions by varying the specific construction of your option trade in order to maximize the probability of success.
In order to form a logical basis for trade selection, it is best to think in terms of each of the three primary forces impacting option pricing- price of the underlying, time to expiration, and implied volatility.
For option traders, one of the fundamental characteristics of the current market is the extremely low implied volatility. The new trader could reasonably pose the question “How would I know that?” There are several answers to that question.
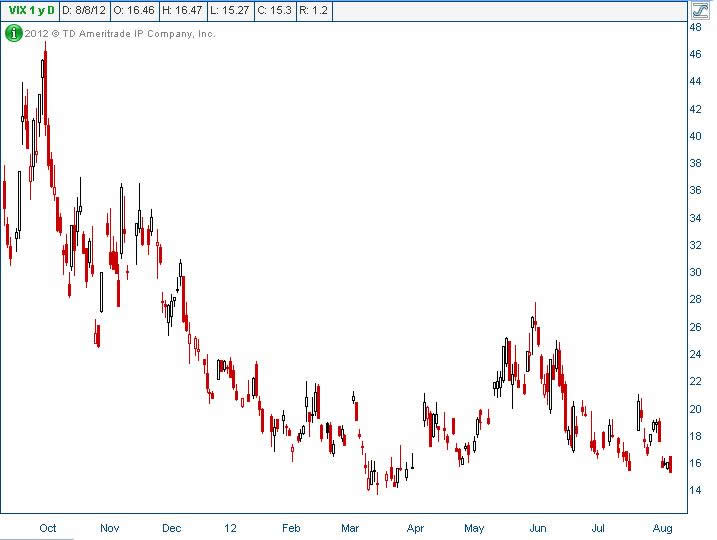
First, the most widely followed indicator of implied volatility is the Volatility Index (VIX). This somewhat arcane calculation reflects the implied volatility of the S&P 500 index options and as such is a useful barometer of the overall market volatility. Its current daily chart is included here for reference. Suffice it to say that it is currently at very low levels.
VIX Trading Chart
Less generally known is that there exist volatility indexes for several of the less broadly followed indices such as the Russell 2000 Index (RUT) whose volatility symbol is RVX. The Powershares QQQ ETF also has its very own volatility index in symbol QQV. These less broadly based calculations are particularly useful when the implied volatility of a specific index is not congruent with the general measures of volatility.
Yet another layer of granularity in volatility calculations exist in a few underlying assets for which the CBOE calculates a volatility level, these include: AAPL, symbol VXAPL; AMZN, symbol VXAZN; GS, symbol VXGS; and GOOG, symbol VXGOG.
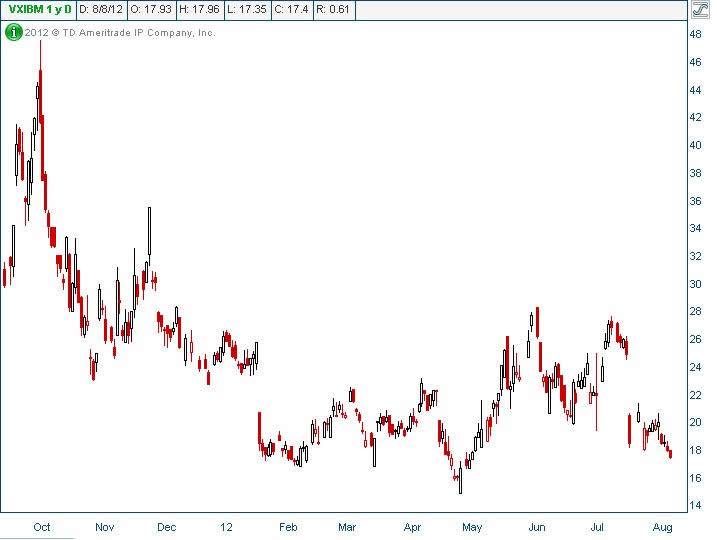
Another stock for which this index is calculated is IBM, symbol VXIBM. Its current chart is presented below:
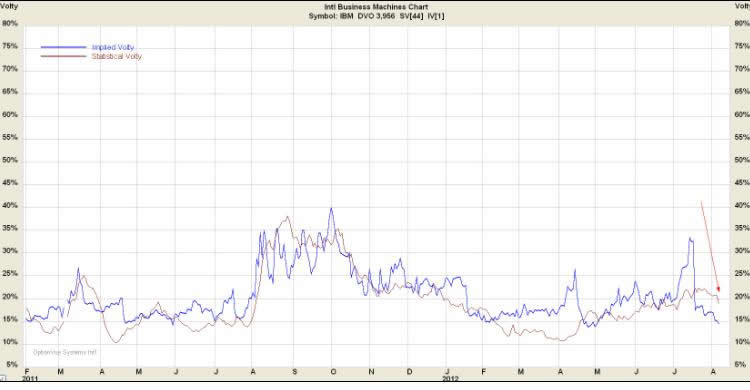
IBM Implied Volatility Chart
Not only is the IBM implied volatility currently at very low levels, it is substantially less than the actual historic volatility (labeled SV in chart below) and in fact it demonstrates the largest downward divergence from historic volatility we have seen this year.
For the option trader, the take home message from this assessment of the current state of implied volatility is that negative vega trades, trades that are inversely impacted by increases or decreases in implied volatility, face a stiff headwind here.
Probabilities strongly favor both a convergence of historic and implied volatilities and return of the current low values of volatility to its historic mean for IBM.
Most option traders usually prefer to enter negative vega trades because this type of trade construction usually benefits from the inevitable and unavoidable passage of time.
Examples of such trades would be naked short puts, butterflies, and iron condors. While such trades are not absolutely contraindicated in the current environment, they are not trade structures we would choose as a first choice.
Let us consider for discussion one of the positive vega trades available in order to increase the probability for a successful outcome. The trade I would like to demonstrate is known as a horizontal spread, a time spread, or most commonly a calendar spread.
The fundamental logic of this spread is to sell a rapidly decaying shorter dated option and buy a longer dated, more slowly decaying option at the same strike price. The specific strikes for the trade are selected so that the short option is out-of-the-money in order to avoid the potential complication of early assignment.
An example of such a trade using the August and September monthly options at the 205 strike is presented below and reflects a mildly bullish price hypothesis for IBM:
IBM Options
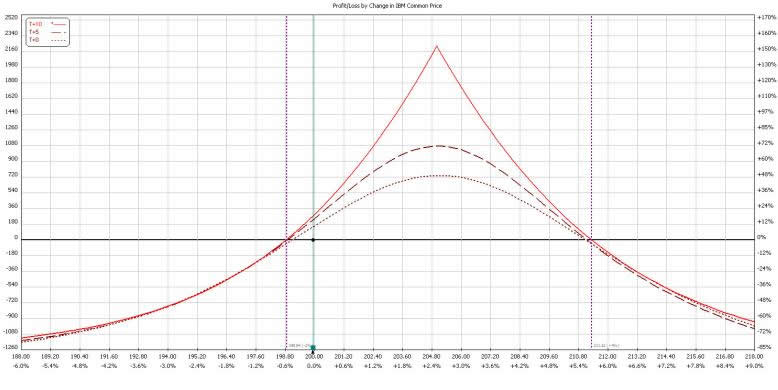
Several points of general applicability for calendar spreads deserve emphasis. Our IBM example has 10 days of total duration and for this example we will be looking at a 10 lot trade costing $1,490.
Most importantly the IBM Calendar Spread reaches maximum profitability at expiration when the underlying is at the strike price. This characteristic is clearly seen in the broken lines on the P&L graph which gradually rise to meet the solid expiration P&L line. I would also point out that the IBM trade has a positive vega of 166 meaning that for every 1 point increase in volatility, the trade profits $166.
The last point of emphasis and what is not immediately apparent from this graph is the potential for additional profit. As expiration of the August 205 call we are short approaches, there exists the ability to sell additional premium in the weekly calls which would then be available.
As with all option trades, it is important to understand crisply the risk of the trade since we can only arrange probabilities in our favor- there are no guarantees of profit.
This trade has a defined maximum risk of the cost incurred to enter the trade. This is the level of absolute maximum risk that has a low probability of occurring since we have the ability to sell additional premium to reduce this outcome or to simply close the trade should market conditions change.
This IBM Calendar Spread is just one example of using the current market conditions to put the wind at your back as an option trader. I invite you to visit our website and try our service to see these ideas in action.
Happy Option Trading!
 If you are looking for a simple one trade per week trading style then be sure to join www.OptionsTradingSignals.com today with our 14 Day Trial.
J.W. Jones is an independent options trader using multiple forms of analysis to guide his option trading strategies. Jones has an extensive background in portfolio analysis and analytics as well as risk analysis. J.W. strives to reach traders that are missing opportunities trading options and commits to writing content which is not only educational, but entertaining as well. Regular readers will develop the knowledge and skills to trade options competently over time. Jones focuses on writing spreads in situations where risk is clearly defined and high potential returns can be realized.
This article is intended solely for information purposes. The opinions are those of the author only. Please conduct further research and consult your financial advisor before making any investment/trading decision. No responsibility can be accepted for losses that may result as a consequence of trading on the basis of this analysis.
© 2005-2022 http://www.MarketOracle.co.uk - The Market Oracle is a FREE Daily Financial Markets Analysis & Forecasting online publication.