Stock Market Trends and Central Bank Balance Sheet Expansion
Stock-Markets / Stock Markets 2012 Sep 02, 2012 - 11:24 AM GMTBy: Submissions
 George Tsiourvas writes: It’s been a slow week, we spent it mostly waiting to get to Bernanke’s speech at Jackson Hole. When we finally got there exactly what we were expecting happened: nothing! A substantial part of Bernanke’s speech went into details regarding cost vs benefit with respect to making monetary policy with non traditional tools. He acknowledged that additional asset purchases have the potential to impair the functioning of securities markets. Read the whole speech here: http://www.federalreserve.gov.... .
This cannot really be what the money printing afficionados have been looking for. No immediate action was announced, simply a routine statement at the end of the speech that the FED is still there to take action if and when necessary shall suffice this time around. Europe is in similar mode, talk a bit, say nothing and mostly: do very little or nothing. Given that markets have bounced strongly over the last 10-12 weeks, given the expectation of heavy central bank intervention, with that expectation turning into dust, it is quite hard to see what everything is still trading that high.
In terms of charts we are now looking at most interesting situations. There are at this moment so many individual charts I could talk about that I will have to spread it over the next several days. Let’s start with the big picture and some monthly charts. First up is American large caps, represented by the SPX, versus Gold. The big picture has not changed at all. The big bull from 1981 to 2000 is still being retraced, it has been a decade long down trend now and no end in sight yet. There has been a bounce out of the 2011 sell off but that topped out in May of this year. Since then the SPX/Gold ratio has been trading lower again.
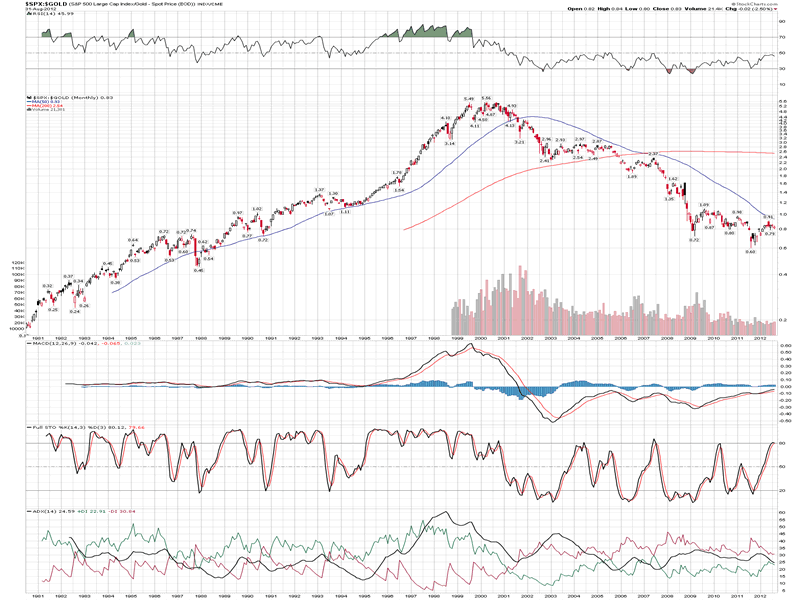
Note the Stochastics in the indicator section of the chart. They show that since 2000, since this relationship started trending down, this indicator never managed to stay above 80 for long. Typically that level has represented a pretty good opportunity to sell. As we are not dealing with a trend change of any kind, not even a hint, I would not see why this should be different this time. The drop will likely stop in the area of the 1981/82 lows which would mean a full retracement of the bull move. I wonder how long it will take to get there.
A similar picture is given by Gold vs Copper. Since the beginning of 2012 that relationship has been attempting to break out higher again and thus get out of a 3 year sideways move post the sharp advance of 2008. In the battle between “growth” (Copper) and “value” (Gold), participants start to be looking more and more for “value” again.
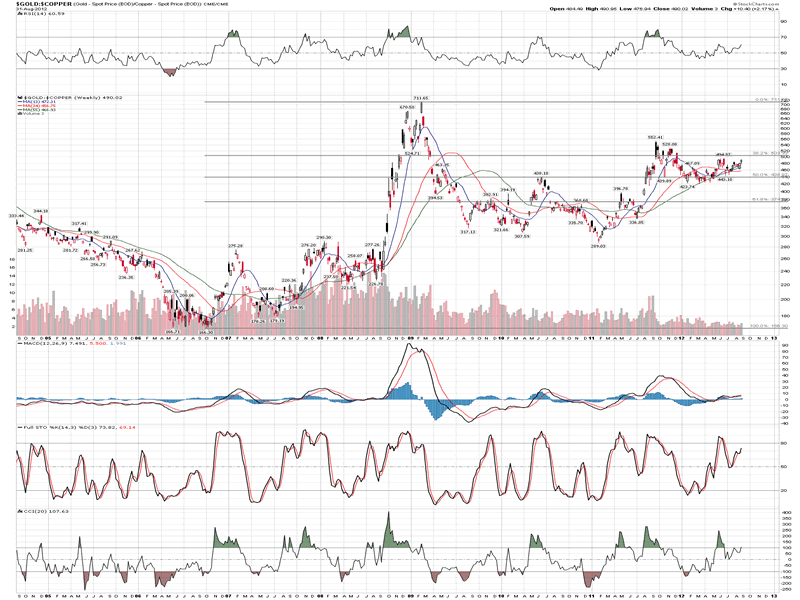
This should not come as a surprise given what we know and hear out of China lately, which obviously feeds through to commodity prices and asset values everywhere else, especially in countries such as Brazil or Australia but also individual sectors, like shipping (no matter if dry bulk, tankers or containers) remain weak as China keeps weakening.
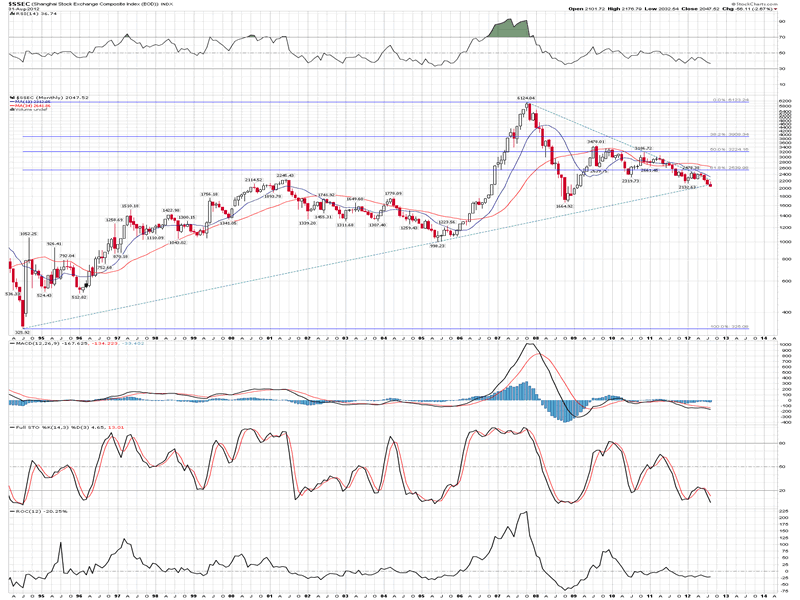
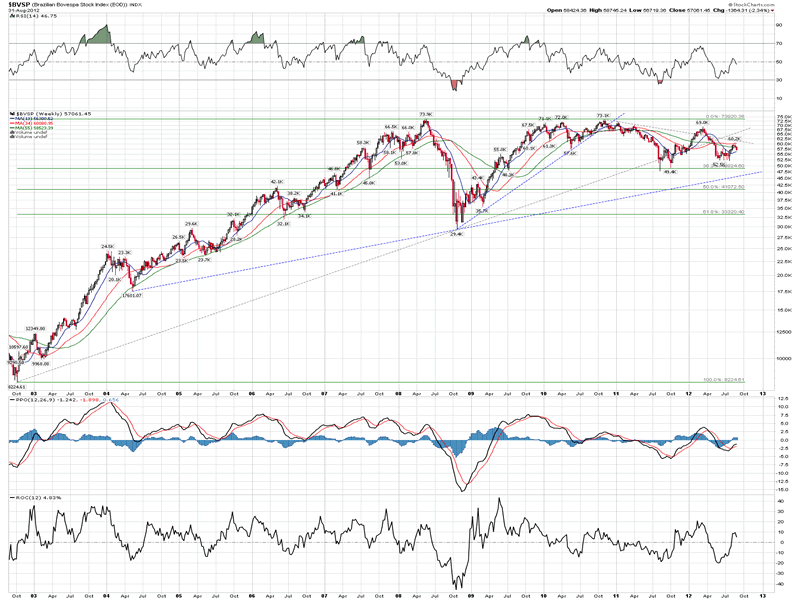
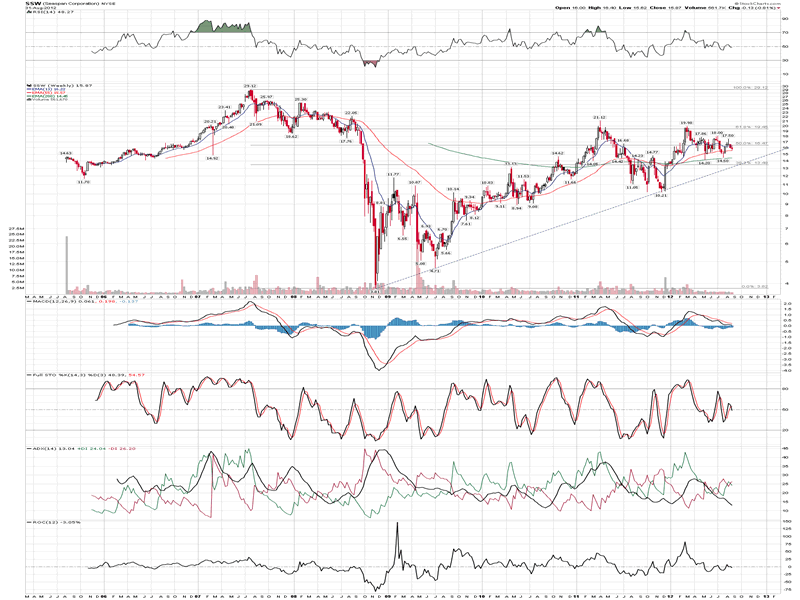
All of the above leads only to one conclusion: central bank balance sheet expansion has done nothing to stop the economic decline. In terms of Gold, which is an item many are not convinced of and it does not pay any dividend either, stocks have been trending lower for 12 years. The best group of stocks has been destroyed in value compared to how Gold has performed. It is hard to argue with a chart picture that strong.
I leave you to have a good look at these charts today. Tomorrow I will be back, narrowing down on the time frame, and looking at some more concrete things for next week and the first half of September.
Have a nice day!
Copyright © 2012 George Tsiourvas - All Rights Reserved Disclaimer: The above is a matter of opinion provided for general information purposes only and is not intended as investment advice. Information and analysis above are derived from sources and utilising methods believed to be reliable, but we cannot accept responsibility for any losses you may incur as a result of this analysis. Individuals should consult with their personal financial advisors.
© 2005-2022 http://www.MarketOracle.co.uk - The Market Oracle is a FREE Daily Financial Markets Analysis & Forecasting online publication.


