


Gold Exhibits Strength!
Commodities / Gold and Silver 2012 Sep 19, 2012 - 01:19 PM GMTBy: Submissions

 Man is least himself when he talks in his own person. Give him a mask, and he will tell you the truth. - Oscar Wilde
This morning the Japanese came out with more easing and it comes on the heels of what China, the ECB and the Fed announced last week. Does anyone see a pattern here? The whole world is once again awash in liquidity. All of this serves to support stocks, commodities and gold although stocks and commodities have been surprisingly flat for the last two sessions. Maybe today will be different. One thing that has been strong, and remains surprisingly strong, is gold. Gold has been heading higher every since it tested the strong support at 1,522.20 way back in May:
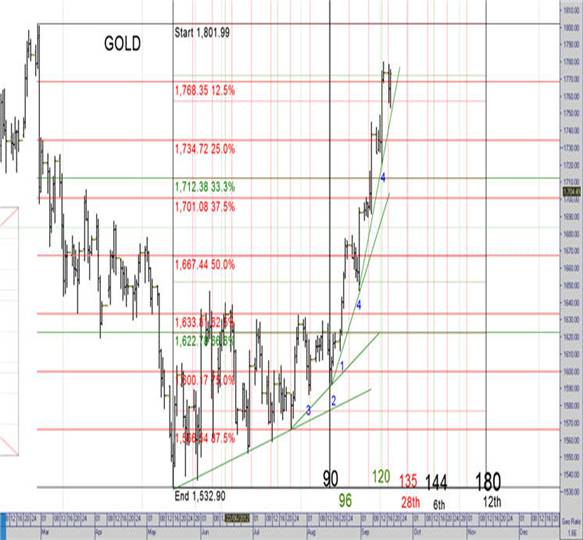
Source: http://www.mclarenreport.net.au
As you can see in the preceding chart the yellow metal went through a period of consolidation for 90 days, using 1,633.00 as a ceiling. Since then the market has taken off and is now closer to vertical in the rise than horizontal.
Yesterday saw spot gold close at 1,773.10 and that is above the resistance at 1,768.35 shown on the chart. This is the second time that gold has closed above it and this morning the price is up another 1.00. Over the long run gold looks very good as it is trading right in the middle of a range that goes back to the beginning of the bull market in 2001:
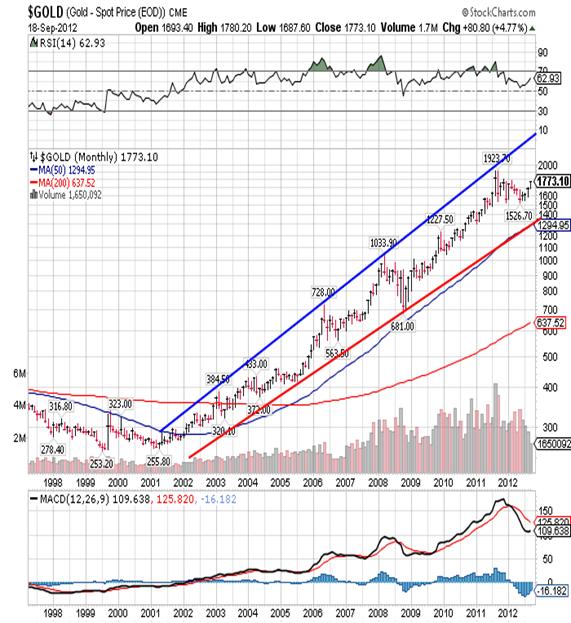
As you can see the gold has now recovered slightly more than 61% of the decline from the 1,923.20 all-time high down to the 1,523.90 low posted in December 2011. I expect a test of the September 2011 all-time high before the end of this year and higher highs early next year.
With that said I see two problems over the very short run. The first problem can be seen here:
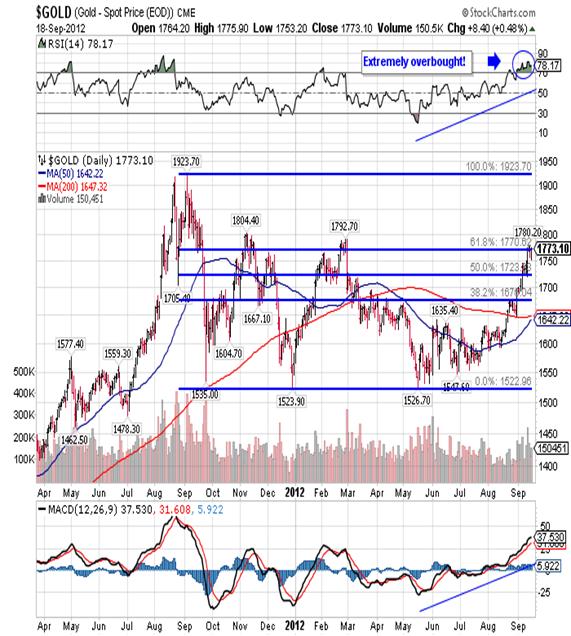
On a daily chart the yellow metal is extremely overbought with RSI slightly above 78.00. Of course I know that things can stay overbought for a long time and the fact that the MACD is still pointed higher tells me that gold could still rally higher this week. With that said I still see a minimum of a four-day reaction coming and I would not be surprised to see it last seven to nine days. The downside target would be 1,734.70 if we’re really lucky, although 1,701.10 would be more realistic. If it were to get ugly then it could dip as low as 1,671.60.
The other warning sign I see is that spot gold has now met its bullish price target of 1,780.00 as given by its Point & Figure chart seen here:
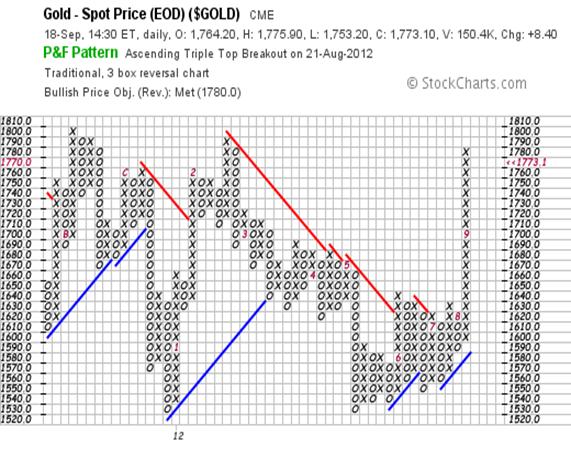
When I first projected gold’s breakout more than a month ago, I used this as my target before we would see any reasonable reaction. This still looks like a good target to me. With that said I would not sell any gold here because it will simply be a reaction that alleviates and overbought condition, and then gold will head higher.
Of course gold does not act alone, it works in concert with silver and to a somewhat lesser degree with gold stocks. When you look at a chart of silver, you see similarities with gold:
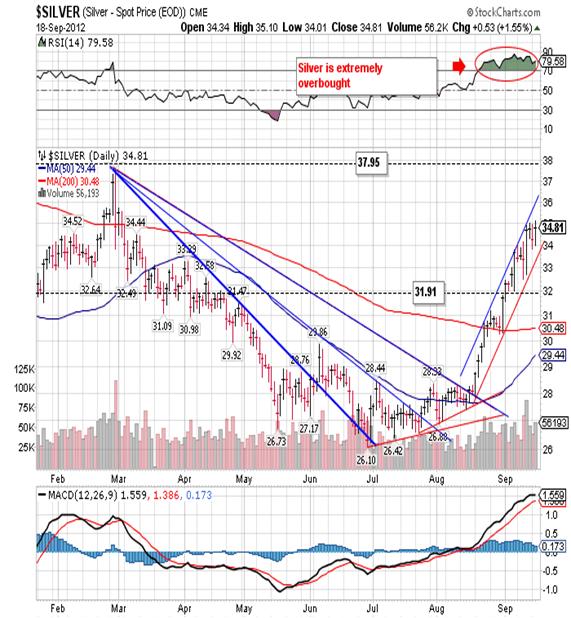
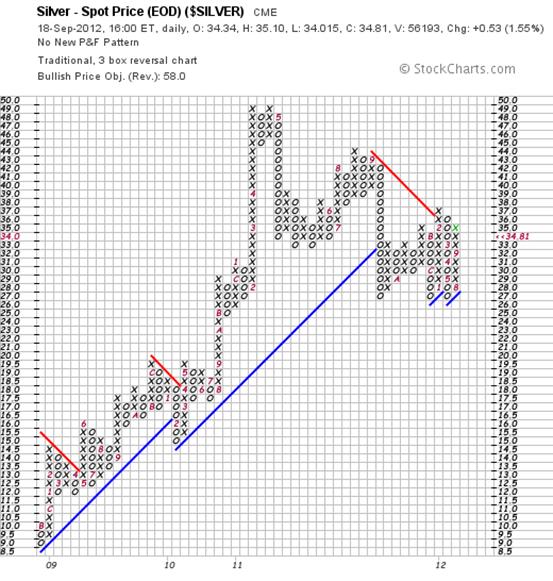
Silver of course is a lot more volatile (manipulated) than gold so we can easily see 1.00 intraday trading ranges. Yesterday was a reasonably quiet day and the range was 1.09. Silver has strong support at 31.91 and decent support at 33.11. Like gold you can see that silver is extremely overbought but unlike gold, it is nowhere near its Point & Figure bullish price target:
Giuseppe L. Borrelli
www.theprimarytrend.com
analyst@theprimarytrend.com
Copyright © 2012 Giuseppe L. Borrelli
- All Rights Reserved Disclaimer: The above is a matter of opinion provided for general information purposes only and is not intended as investment advice. Information and analysis above are derived from sources and utilising methods believed to be reliable, but we cannot accept responsibility for any losses you may incur as a result of this analysis. Individuals should consult with their personal financial advisors.
© 2005-2022 http://www.MarketOracle.co.uk - The Market Oracle is a FREE Daily Financial Markets Analysis & Forecasting online publication.