US Fed Interest Rates Cuts Save the World from Financial Meltdown?
Stock-Markets / Financial Markets Feb 09, 2008 - 03:59 PM GMTBy: Tim_Wood

 Just as the equity markets were pushing into their anticipated turn point in late January, the Fed makes a 75 basis point cut of the Discount rate. This was the most aggressive rate cut since August of 1982. The very next week at the regularly scheduled Fed meeting they cut yet another 50 basis points. To hear the spin from the mainstream these cuts were done to save the equity markets from the woes that first began in August. I have heard many of the analysts and commentators explain why the bottom is now in and how the Fed has finally made everything alright.
Well, did any of these mainstream analysts and commentators, who are just mouth pieces for Wall Street, warn you of the over extended 4-year cycle? Did they not say that the bottom was in place in August and then again in November? Did they not say that the 4-year cycle bottom was either behind us or that it no longer matters? Did they not tell you in November when the Primary Dow theory Trend change occurred why it wasn't really applicable? Have we not been lead to believe by the mainstream talking heads that the rate cuts by the Fed will prevent the equity markets from further erosion?
From my perspective I can assure you that the extended 4-year cycle in which I have been so adamant about topped in October. I can also tell you that the Dow theory primary trend change that occurred in November is still intact, in spite of suggestions that the Dow theory is turning bullish. Furthermore, I can tell you that when we look at the facts , rate cuts by the Fed is not likely to stop the ongoing market decline. As a matter of fact, the notion that the Fed can control the markets by manipulating interest rates falls under the category of urban legend.

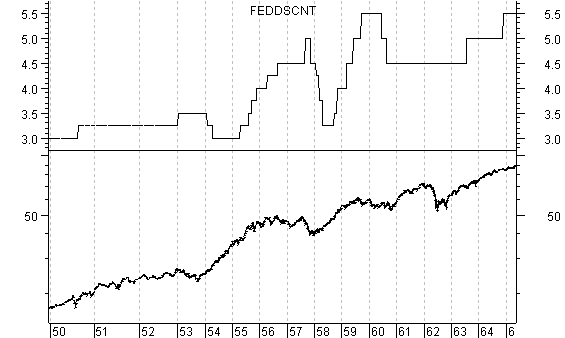
Below I have plotted a chart of the S&P 500 and I have included the Discount rate in the upper window.
Beginning in 1950 we see a rate increase from 3.0% to 3.25%. During this period the S&P 500 rose by some 50% on the back of this rate increase. In January 1953 the equities made a 4-year cycle top and the low in late 1953 marked the 4-year cycle bottom. Note that interest rates were cut in early 1954 as the equity markets began to climb out of the 4-year cycle low. Now some will argue that the equity markets rose because of the rate cut. Not exactly! First of all, my Fed model signaled in September 1953 that a rate cutting cycle was at hand. Then as short-term interest rates, ie T-Bill rates, began to decline the Fed was forced to follow by cutting their Discount rate. It was then in February 1955 that my Fed model turned back up signaling that a rate hiking cycle was at hand. It was then in April 1955 that short-term T-Bill rates had advanced to the point that the Fed was again forced to follow short-term rates up just as my Fed model signaled two months earlier.
In the wake of this new rate hiking cycle the Discount rate was raised from 3% to 5%. During this time the S&P moved up 122% from the 1953 4-year cycle lows into the 1956 4-year cycle top. Point being, rates went just as the Fed model suggested and the equity markets also advance. So, we certainly can't say that rising rates are negative for equities. Also note that the Fed continued raising rates into 1957, which was after the 1956 top in equities. Again, many may look at this chart and conclude that the Fed cut rates because of the fact that equities were declining. Not True! The truth is that the Fed began cutting rates in 1957 because again, the short-term T-Bill rates forced them to do so. All the Fed was doing was following the T-Bill rates. Short-term T-bill rates peaked in October 1957. By November the short-term T-Bill rates had fallen enough to force the Fed once again into another rate cutting cycle.
Also in October 1957 the S&P 500 made its 4-year cycle low and again equities began moving up into the 1961 4-year cycle top. In looking only at this chart one could argue that because the Fed began to cut rates in the second half of 1960 that they saved the equity markets once again. Again, this is not true. My Fed model signaled that another rate cutting cycle had begun in May 1960. It was then in June that short-term T-Bill rates had fallen enough to force the Fed to begin cutting once again just as my Fed model showed a month before. As for the equity markets, the historical “DNA markers” of the 4-year cycle were seen in late 1961 and early 1962. The point here is that the market can indeed advance in the wake of rising rates. More importantly, I want to point out that when we look at a chart of the equity markets and interest rates it may first appear that the Fed's raising and lowering of interest rates is in response to the equity markets. However, there is a major piece of the puzzle missing if that conclusion is drawn based upon the chart of the S&P and the Discount rate. Fact is, we have a 4-year cycle ebbing and flowing within the stock market and at the same time we have the ebbing and flowing of the short-term interest rates, in which the fed follows ! Sometimes the direction of these cycles mesh and sometimes they don't.
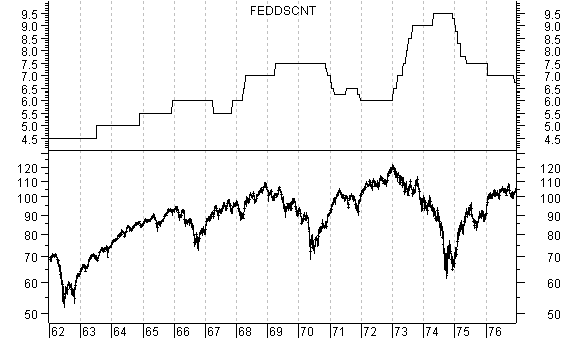
Moving on to the next chart below I have once again included the S&P 500 and the Discount rate in the upper window. From the 1962 4-year cycle low, the equity markets began moving up. Again, it was well after the low in equities was reached that interest rates began to rise. In fact, my Fed model signaled that the rate cutting cycle was over in January 1962 and that higher rates should follow. It wasn't until June 1963 that short-term rates rose enough to force the Fed to once again follow the short-term T-Bill rates higher.

I'm not going to go through every crook and turn in this chart, but you can clearly see that as the equity market moved up out of the 1962 low the Discount rate moved from 4.5% in 1962 to 7.5% in 1969. The decline by equities into 1970 was simply marking another 4-year cycle low. Note that this time around the Fed did not begin to cut rates until November 1970, which was well after the 4-year cycle low in equities. Why didn't they cut sooner and “save the market?” Simple! The short-term T-Bill rates would not allow it. Then in September 1972 my Fed model signaled another rate hike cycle. Following this Fed model signal, in January 1973, the short-term T-Bill rates had risen to the point that the Fed was again forced to follow and began raising the Discount rate. This occurred right as the equity markets were making the 1973 4-year cycle top. So, once again, on the surface if one is only looking at the chart of equities and the Discount rate above they would conclude that because the Fed raised rates the stock market went down. Again, there is a big piece of the puzzle missing.
Fact is, the ebb and flow of the 4-year cycle in the equity markets is independent from the ebb and flow of the short-term credit markets and the Fed's rate cutting and rate hiking cycle. Guess what? In November 1974 my Fed model turned down signaling that we had once again entered into a rate cutting cycle. It was then in December 1974 that the Fed began cutting rates, which was well after the 1974 4-year cycle low. My Fed model continued to show that rate cutting cycle to be in effect until July 1977, at which time it showed that another rate hiking cycle was born. It was then the week of September 2, 1977 that the Fed began to raise rates. Equities made a 4-year cycle low in 1978 and rates steadily rose into their 1981 highs as the equity market also moved up into their 1980 4-year cycle top. Again, we had rising rates, rising equities and independent movement of the cycles.
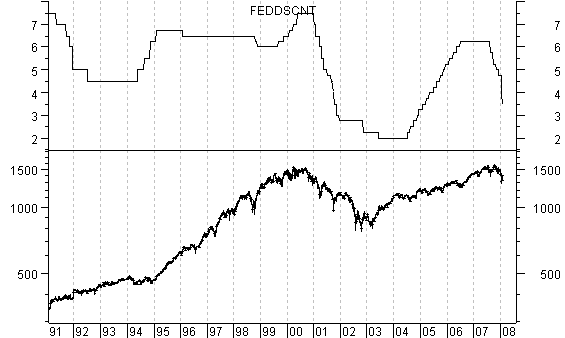
In November 1981 My Fed model once again rolled over triggering another rate cutting cycle. There were brief periods between 1981 and 2000 that my Fed model turned up. These turns were all brief and on balance my model pointed toward lower rates during the 1982 to 2000 bull market. It is my belief that it was this period of lower interest rates and higher equity markets that is responsible for the birth of the common and erroneous perception that lower interest rates automatically equate to higher equity prices . This perception is simply not true! In fact, for a portion of the late 1990's the Fed model was positive and the Discount rate moved up to 7.5% as the equity markets pushed into their final tops. In 2000 the equity markets again made 4-year cycle tops. It was then in February 2001 that the Fed model confirmed that we had entered into another rate cutting cycle. From February 2001 down into the 4-year cycle low, the S&P 500 fell over 41% in spite of the drastic rate cuts that were seen in the wake of the Fed model turning down. This can be seen on the chart below and obviously, cutting rates did not stop the decline in equities.
The Fed model continued to suggest lower rates until it turned positive in September 2003, at which time short term rates stabilized. It was then in July 2004 that short-term T-Bill rates forced the Fed to begin raising rates. That rate cutting cycle ended independently of the 4-year cycle in equities, which had occurred way back in October 2002. The rate hike cycle that was signaled in September 2003 remained intact until June 2007 when it was reversed. It was then in August 2007 that the Fed began cutting rates. At that time the equity markets were weakening and we were told that the rate cuts were designed to hold the equity markets.

Horsefeathers! My Fed model turned down in June 2007 and soon afterwards short-term T-Bill rates began collapsing, which forced the Fed to cut the Discount rate. Then in October the over extended 4-year cycle that I have been screaming about finally peaked. As the decline from that high got into gear more rate cuts followed and we were again lead to believe that these rate cuts were designed to hold the equity markets. Not true! It was the collapsing short-term T-Bill rates that forced the Fed to cut rates. The 4-year cycle in the equity markets and the rate hike and cut cycles, as defined by my Fed model, are totally independent events and it so happens that both are now moving down! The last time this occurred was surrounding the 2000 4-year cycle top in equities and the 2001 top in the Fed model.
The decline into the 4-year cycle is still alive and well. The Dow theory primary trend change that occurred in November is still alive and well. The ongoing rate cut cycle is also still alive and well. Lowering rates in this environment will not save the equity markets. Furthermore, it was the erroneous belief that was apparently born as a result of the 1982 to 2000 bull market that has everyone convinced that it will. The mis-information by Wall Street and their great propaganda machine is in high gear. The equity markets will bottom when the 4-year cycle low is made and this rate cutting cycle, which is an independent event, will not bottom until my Fed model turns up. Furthermore, the Fed clearly reacts to the natural short-term credit market forces and then spins the news to try to pacify the masses. I realize that this may come as a shock to many. You have been warned!
I have begun doing free Friday market commentary that is available at www.cyclesman.com/Articles.htm so please begin joining me there. Should you be interested in more in depth analysis that provides intermediate-term turn points utilizing the Cycle Turn Indicator, which has done a fabulous job, on stock market, the dollar, bonds, gold, silver, oil, gasoline, the XAU and more, those details are available in the newsletter and short-term updates. A subscription includes access to the monthly issues of Cycles News & Views covering the Dow theory, and very detailed statistical based analysis plus updates 3 times a week.
By Tim Wood
Cyclesman.com
© 2007 Cycles News & Views; All Rights Reserved
Tim Wood specialises in Dow Theory and Cycles Analysis - Should you be interested in analysis that provides intermediate-term turn points utilizing the Cycle Turn Indicator as well as coverage on the Dow theory, other price quantification methods and all the statistical data surrounding the 4-year cycle, then please visit www.cyclesman.com for more details. A subscription includes access to the monthly issues of Cycles News & Views covering the stock market, the dollar, bonds and gold. I also cover other areas of interest at important turn points such as gasoline, oil, silver, the XAU and recently I have even covered corn. I also provide updates 3 times a week plus additional weekend updates on the Cycle Turn Indicator on most all areas of concern. I also give specific expectations for turn points of the short, intermediate and longer-term cycles based on historical quantification.
Tim Wood Archive |
© 2005-2022 http://www.MarketOracle.co.uk - The Market Oracle is a FREE Daily Financial Markets Analysis & Forecasting online publication.


