


Stock Market Uptrend Pullback Continues
Stock-Markets / Stock Markets 2012 Sep 24, 2012 - 09:14 AM GMTBy: Tony_Caldaro

 It was a relatively quiet Options expiration and week in this US. The entire range for the week was SPX 1450-1467, and those numbers were achieved on thursday and friday. For the week the SPX/DOW were -0.25%, and the NDX/NAZ were mixed. Asian markets were -0.3% , European markets were -0.7%, and the DJ World index lost 0.7%. On the economic front positive reports outpaced negative reports 7 to 3. On the uptick, the NAHB index, housing starts, existing home sales, the monetary base and the WLEI; plus the Philly FED and currect Account balance improved. On the downtick: the NY FED, building permits and leading indicators. Weekly jobless claims were unchanged. Next week we get a look at Q2 GDP, Personal income/spending and PCE prices.
LONG TERM: bull market
The US bull market continues to unfold as expected. Yet, before all is said and done, this bull market may surprise a lot of market pundits. One is forced to admit the liquidity provided by the FED’s QE programs has fueled the economic recovery, and this bull market. The FED’s monetary base has risen from $875 bln, at the end of 2008, to $2.656 tln this week. This reflects the two QE programs of $1.4 tln and $600 bln.
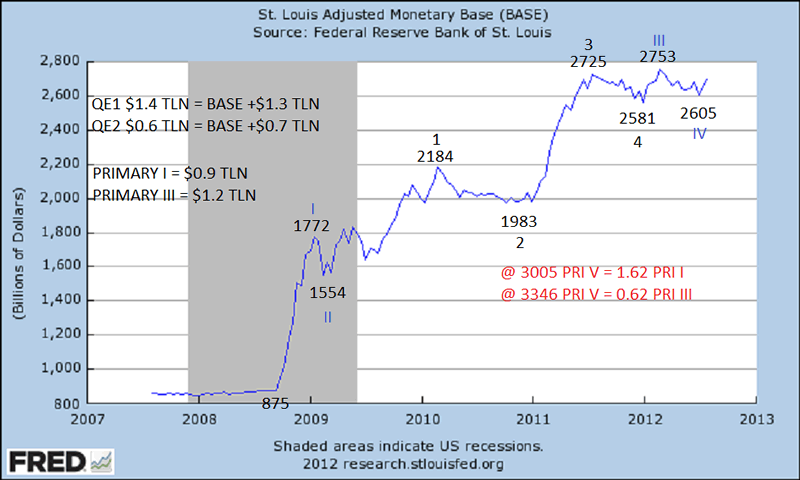
We have been tracking the Monetary base in OEW terms. And, it has been unfolding in perfect Elliott Waves. After some fibonacci calculations we can now project two possible levels where the rise in the monetary base, and the liquidity programs, could end. The first possible level is at $3.005 tln. This would suggest QE 3 will end around mid-2013. The next, and most probable, level is $3.346 tln. This would suggest QE 3 runs until the end of 2013. Should QE 3 last this long, this bull market should post some fairly impressive numbers before it ends.
Our weekly chart continues to display good technicals for the bull market. The RSI getting extremely overbought during advances, and slightly oversold during declines. The MACD remaining mostly above neutral which it does only during bull markets. The OEW wave count continues to unfold as posted.
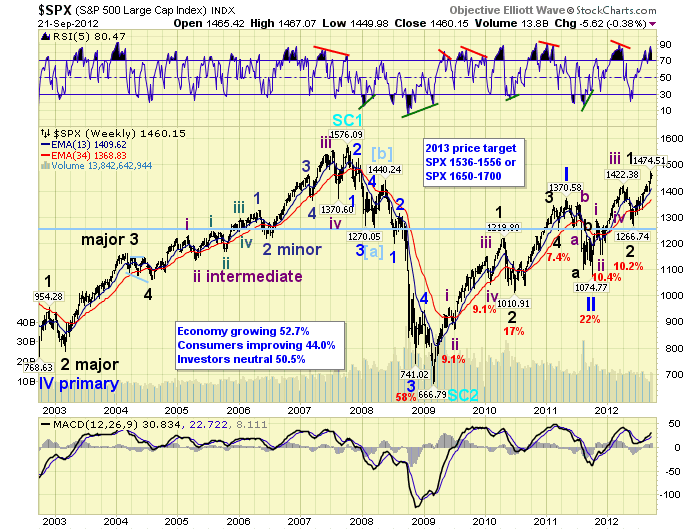
This bull market is Cycle wave [1] off the March 2009, SPX 667 low. It should unfold in five Primary waves. Primary waves I and II concluded in 2011, and Primary wave III has been underway since that SPX 1075 low. Primary I divided into five Major waves, with Major wave 1 subdividing into five Intermediate waves. Primary wave III also has five Intermediate waves during Major wave 1, then corrected in Major wave 2 at SPX 1267. Major wave 3 has been underway since that low. When Major wave 3 concludes, we should see a Major 4 correction, then a rising Major 5 to complete Primary III. Then after a Primary IV correction, Primary wave V will complete the bull market. We are still anticipating this will all conclude by mid-late 2013.
MEDIUM TERM: uptrend
The current uptrend, Major wave 3, began in early June at SPX 1267. Since that low the market has risen 16.4% in just a week short of four months. Major wave 3, of Primary I, rose 32.9% in seven months. It was aided by the $600 bln QE 2 program. This Major wave 3 is now being aided by the $40 bln/mth QE 3 program. If this uptrend continues into January, seven months, we should be looking at soft fairly lofty numbers when it concludes. For now, however, we remain with our original projections.
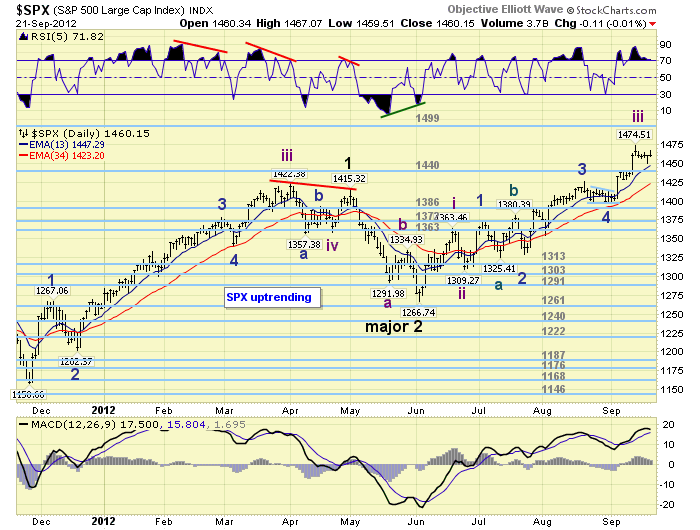
When this uptrend began in June we projected it should last into year end and conclude near the OEW 1499 pivot. The projection was made when the FED was only dealing with the $667 bln program Operation Twist. When QE 3 was announced, a week ago, the market leaped past the OEW 1440 pivot, and our fibonacci resistance level at SPX 1463/64. The uptrend has since stalled at that latter resistance level. We now expect this uptrend to end near either the OEW 1499 pivot, or the 1523 pivot, and maybe higher. We will just take it one pivot at a time. Medium term support is at the 1440 and 1386 pivots, with resistance at the 1499 and 1523 pivots.
SHORT TERM
Short term support is at the 1440 pivot and SPX 1422/27, with resistance at SPX 1463/64 and the 1499 pivot. Short term momentum hit slightly overbought on friday, then ended the week below neutral. The short term OEW charts have remained positive from SPX 1412, with the swing level now at 1455.
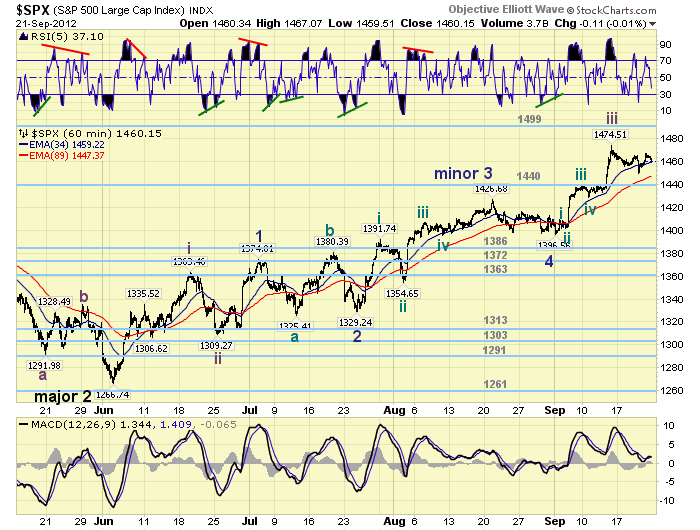
We have counted this Major wave 3 uptrend as five Intermediate waves, with a subdividing and somewhat complex Intermediate wave iii. Int. waves i and ii completed at SPX 1363 and 1309 respectively. Int. wave iii appears to have completed at the recent SPX 1475 high, with Int. iv underway now. Int. wave ii was a quick zigzag with a pullback of about 50 SPX points. Int. wave iv should now be more complex, take more time, and have a shallower pullback. The fourth waves, during this uptrend, have mostly been minor and have taken the form of triangles. Yet, we can not rule out a flat or double three pullback. The main technical factor we are looking for, to conclude Int. iv, is an oversold/near oversold daily RSI. Currently it is still overbought. Looks like this wave needs more time to unfold. Best to your trading!
FOREIGN MARKETS
The Asian markets were mixed on the week losing 0.3%. China remains in a downtrend since May, and Singapore is trying to confirm a new uptrend.
The European markets were also mixed losing 0.7% on the week. All indices remain in uptrends.
The Commodity equity group were all lower on the week for a 2.0% loss. All indices here remain in uptrends as well.
The uptrending DJ World index lost 0.7% on the week.
COMMODITIES
Bonds have been in a downtrend since early June, but gained 0.7% on the week.
Crude had quite a selloff this week losing 6.0%. That negative divergence certainly took its toll.
Gold continues to uptrend and gained 0.1% on the week.
The USD remains in a downtrend, was quite oversold recently when it reached support at 78+, but gained 0.6% on the week.
NEXT WEEK
The economic week starts on tuesday as September comes to an end. On tuesday: we have Case-Shiller, Consumer confidence and the FHFA housing price index. Wednesday: New homes sales. Thursday: Q2 GDP, weekly Jobless claims, Durable goods orders and Pending home sales. Then on friday: Personal income/spending, PCE prices, the Chicago PMI and Consumer sentiment. The FED still has nothing scheduled. Best to your weekend and week.
CHARTS: http://stockcharts.com/...
http://caldaroew.spaces.live.com
After about 40 years of investing in the markets one learns that the markets are constantly changing, not only in price, but in what drives the markets. In the 1960s, the Nifty Fifty were the leaders of the stock market. In the 1970s, stock selection using Technical Analysis was important, as the market stayed with a trading range for the entire decade. In the 1980s, the market finally broke out of it doldrums, as the DOW broke through 1100 in 1982, and launched the greatest bull market on record.
Sharing is an important aspect of a life. Over 100 people have joined our group, from all walks of life, covering twenty three countries across the globe. It's been the most fun I have ever had in the market. Sharing uncommon knowledge, with investors. In hope of aiding them in finding their financial independence.
Copyright © 2012 Tony Caldaro - All Rights Reserved Disclaimer: The above is a matter of opinion provided for general information purposes only and is not intended as investment advice. Information and analysis above are derived from sources and utilising methods believed to be reliable, but we cannot accept responsibility for any losses you may incur as a result of this analysis. Individuals should consult with their personal financial advisors.
© 2005-2022 http://www.MarketOracle.co.uk - The Market Oracle is a FREE Daily Financial Markets Analysis & Forecasting online publication.