Gold Analysis : The Best Risk/Reward Trade Available
Commodities / Forecasts & Technical Analysis Feb 19, 2007 - 12:05 AM GMTBy: Dominick
“The expectation therefore is that the action of a single day will not to buck the larger trend, which is for yields to continue their move lower.”
For the last two weeks, this update has been alerting readers to the fact the U.S. economy needs lower interest rates, in the form of bond yields, and household liquidity, in the form of a higher stock market. The effects of these moves would be to encourage buyers' working off the housing supply glut and to save the mortgage lending industry from collapse. It must be simply a coincidence that the pace of both these trends, lower yields and higher stocks, accelerated last Wednesday on Chairman Bernanke's testimony.
As you know, Bernanke told the Senate Banking Committee he was optimistic about a sustainable level of growth in the U.S. economy and that inflation appears contained. Naturally, these sentiments prompted buying in both stocks and bonds since sustainable growth tends to ensure corporate earnings and contained inflation allows bond investors to accept lower rates of return.
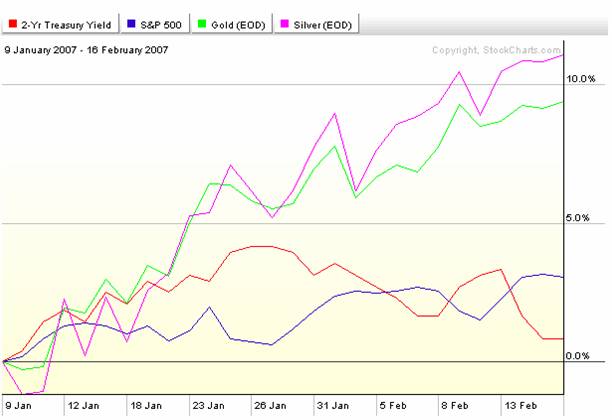
Those of us following the money had noticed weeks ago how metals had been moving up with stocks as the growing economy kept inflation fears alive, and that this also tended to create a positive correlation with bond yields. But, as the chart below illustrates, that relation with bonds has now been severed.

While it seems desirable for the trends in stocks and bonds to continue, the data released since Wednesday has called their sustainability into question. Given Bernanke's dovish testimony, and the relative decline in hawkish Fedspeak in general, the bond market is now beginning to again expect an eventual rate cut, which is fueling inflation expectations and keeping metals prices strong. Since long term bonds are most sensitive to inflation rates, the contained inflation rhetoric has caused a more pronounced decline in 30 year bond yields, further inverting the yield curve and muddling the economic outlook.
Despite the decline in oil price, consumer inflation expectations have remained high and sentiment has declined. While a slowdown in housing starts is probably beneficial to the overall economy, homebuilders are still far from signaling a recovery. There's also no clear trend in manufacturing, which has appeared very anemic recently, but could also be showing initial signs of a regained strength.
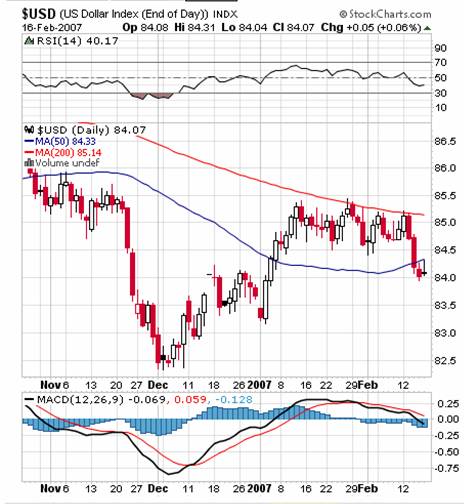
Obviously, next week's inflation data will be crucial for determining the future of interest rates and precious metals, but there's also crucial developments set to unfold in the dollar and foreign currencies. The chart below shows the dollar index trading below resistance at its 50 day moving average after a recent failed attempt at a bullish crossover in the MACD.

Metals have been unable to fully capitalize on this decline for a number of reasons, mostly pertaining to weaker economic data and contained inflation rhetoric. A continued decline, however, would tend to be bullish, but not necessarily so. As other commentators have described, precious metals gain not just through a weaker dollar, but through weaker government paper in general, which is why gold and silver are priced higher today than five years ago in all currencies.
Even though the G7 meeting did not reach any public conclusions about the Yen, the global policy determined at the meeting will probably be expressed in the Bank of Japan meeting next week, where interest rates are expected to rise. In fact, expectation of a rate hike has been fueling the recent dollar weakness. Since the Yen carry trade is the primary source of the world's liquidity today, higher interest rates in Japan could hurt both the dollar and gold.
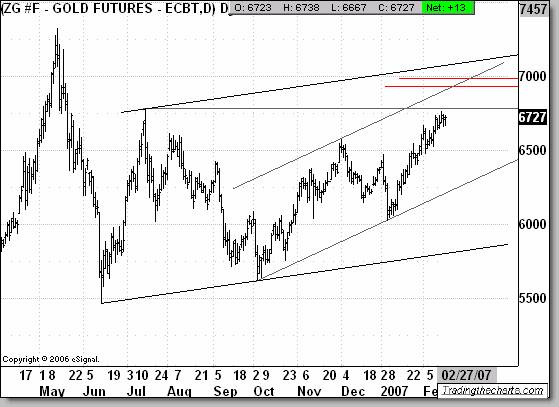
Readers last week were apprised of the many bullish forces aligning behind precious metals, but also cautioned to look for better entry points. Even with bullish seasonality, money supply inflation, higher demand and geopolitical instability all creating a floor beneath gold and silver, it's still going to take a decisive catalyst to send these metals rocketing back to last May's highs and beyond. Though this window of opportunity will not be open forever, the next chart shows it would take, at the very least, a decisive move above last summer's highs to confirm a breakout.

(chart by Dominick)
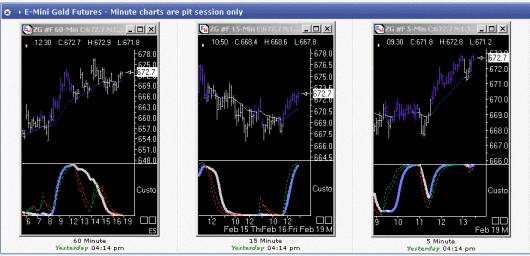
While most precious metals investors probably have long term gains as their first priority, few would question that understanding the short term fluctuations in price can be very helpful in identifying ideal entry points with low risk to reward ratios. Of course, there are also short term traders out there using the volatile metals markets to turn quick profits. For both styles of trading, TTC is proud to now offer its proprietary trend charts for the gold futures market.

As you can see from the screen capture above, TTC's unique system uses proprietary trend charts in multiple time frames to spot key reversals and identify optimum buy and sell points. To get updates on all the ongoing fundamental and technical setups in precious metals, as well as the gold trend charts, join TTC for just $50 per month, simply the best risk/reward available!
By Joe Oroborean
© 2005-2022 http://www.MarketOracle.co.uk - The Market Oracle is a FREE Daily Financial Markets Analysis & Forecasting online publication.


