Stock Market DOW Index Short Term Forecast October 2012
Stock-Markets / Stock Markets 2012 Sep 26, 2012 - 02:37 AM GMTBy: Dan_Stinson
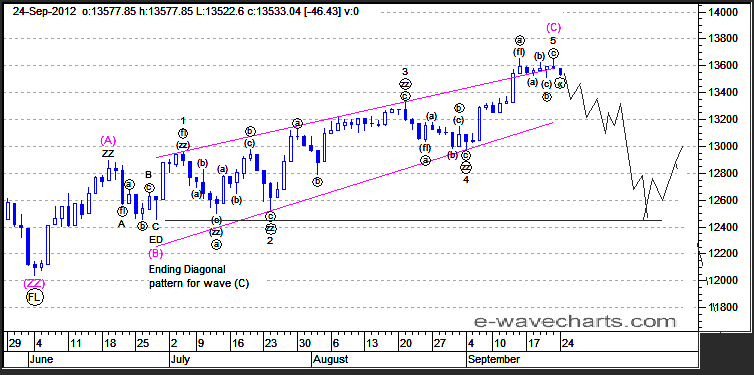
 Elliott Wave on the DOW - DOW Ending Diagonal Patterns
We have been tracing out two ending diagonal patterns for the DOW. The smaller ED pattern and possibly the larger ED pattern completed on Sept 23rd. The corrective choppy action in wave (C) up is an ending diagonal pattern which is a terminal pattern. We should see further downside on the first chart below the lower trendline with a sharp decline to at least the starting point of the ED pattern at 12400.
We may see a rally at this level, which could be part of the larger ED pattern if it isn't complete, but we will know well before the target is attained. The first chart below was posted on the site on Sept 24th and illustrates the smaller ED pattern. We can also see the same smaller and larger ED patterns for the NAS and the SPX. We also saw an even smaller ED pattern this morning to complete wave C of wave 2 up with the expected downside to follow.


If both patterns are complete, then a sharp decline below the 2009 lows would be expected. If the larger pattern is still in play, then after further downside, we would see another rally to the recent highs to complete the larger ED pattern. Either way, once the larger ED pattern is complete, substantial downside is ahead.
These charts are only a guide so that you can follow the action and monitor the expected outcome. The action could play out exactly as illustrated or it may need minor adjustments as we follow it through.
If you are interested in viewing these updated charts and other detailed charts with targets on a daily basis, please see the registration details below.
Elliott Wave Chart Site - IntraDay Market Updates on the DOW, Nasdaq, S&P500, Gold, Silver, HUI and the USD.
To learn more on the status of Gold, Silver, HUI and the USD, please visit the link below for registration details. The commentary and forecasts are updated daily, including intraday commentary and chart updates. Fibonacci pivot dates and cycle analysis are also utilized to forecast reversal dates. The indices covered include the NASDAQ, DOW, S&P 500, SOX, Nikkei, DOW Transports, TSX, BSE, KSE, AORD, HSI, DAX and FTSE. Commodity charts include Copper, XOI, Crude Oil, Nat Gas, Gold, GLD ETF, Silver, SLV ETF, HUI and/or the XAU (Gold and Silver index). Additional Elliott Wave charts cover the US Dollar (USD), EURO FXE ETF, Canadian Dollar (CAD) FXC ETF, 10 Year Treasury Note Yield (TNX), Bank Index (BKX)
With market timing and Elliott Wave Forecasts, we can be on the right side of the market.
Happy Trading!!!
Dan Stinson
Elliott Wave Chart Site e-wavecharts.com
(AEM) and Denison Mines.
Dan Stinson Archive |
© 2005-2022 http://www.MarketOracle.co.uk - The Market Oracle is a FREE Daily Financial Markets Analysis & Forecasting online publication.


