


Gold Price Set for Sharp Drop, Opportunity to Go Short
Commodities / Gold and Silver 2012 Oct 08, 2012 - 01:46 AM GMTBy: Clive_Maund

 It has been widely assumed across the markets that the forces of deflation have been vanquished by the Fed's making it plain a couple of weeks ago that it is going to throw all of its firepower into the battle to defeat it. So let's make this as clear as possible - the forces of deflation will not be defeated by anything until they done their work of expunging the massive overhang of debt from the system. The Fed's latest stated policy is merely a display of desperation and a symptom of intellectual bankruptcy in that they seem to think that more of what created the problems in the first place is now going to somehow fix them. We are going into a depression anyway, and they have made it plain that for good measure they are going to destroy the currency into the bargain. In reality, all they are trying to do is buy as much time as possible - they know they are cornered and that the system is doomed and procrastination is all that is left to them.
Anticipation of the QE to eternity proclamation by the Fed drove the dollar down steeply, and simultaneously drove the Precious Metals higher. After the announcement was made the dollar crept higher as the dollar unfriendly news was then all priced in and it was oversold and entitled to a relief rally, and at the same time the Precious Metals trod water, moving sideways.
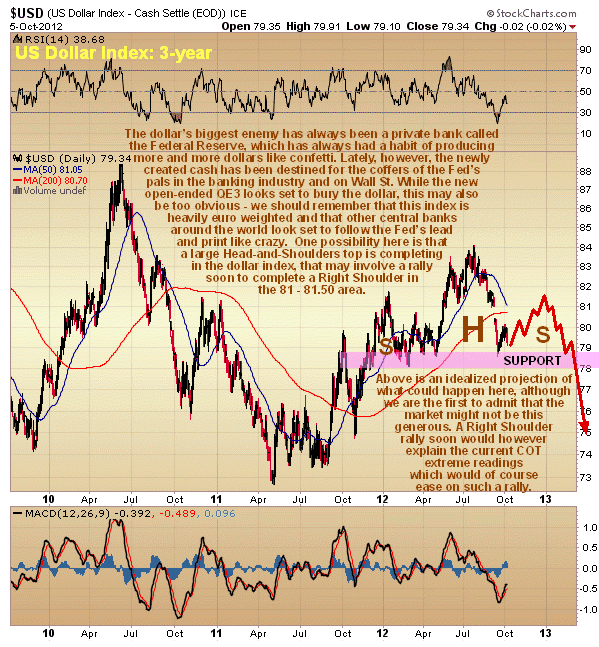
Right now the belief is widespread that the dollar has just completed a "bear Flag" and that another vicious downleg is starting, which will synchronize with a big rally in the Precious Metals, that many investors have positioned themselves for, but we are instead seeing important and compelling evidence that before the dollar continues much lower it will first stage a significant countertrend rally that will trigger a fairly short but possibly brutal selloff in Precious Metals markets, and if another deflationary scare should occur at some point despite the QE largesse, any such rally could be amplified by a Pavlovian flight into US debt and thus into the dollar. Let's now review this evidence.
Our 3-year chart for the dollar index shows that there is now a quite high degree of "compression" - it has dropped a considerable distance below a still flat 200-day moving average to become oversold. The tendency to proportion in markets points to a rally of the kind projected on this chart, to complete the Right Shoulder of a large Head-and-Shoulders top. Why, fundamentally, might it do this? - here's one very good reason; right now sentiment towards the dollar is awful, it is at negative extremes with only about 7% confident of a dollar rally. That kind of extreme just by itself is enough to generate a rally, if only because there's virtually no-one left to turn bearish. Another good reason is that upon the Fed's QE announcement the dollar was broadly written off as "toast", with those doing the writing off temporarily forgetting that many other countries have plenty of reasons of their own to debase their currencies, not least Europe, which pipped the Fed at the post when the German court members, dressed in fancy red finery, and perhaps feeling the nozzle of a gun at their backs, cleared the way the day before the Fed's revelations for massive European QE. So as the various fiat currencies jockey for position in the race to the bottom, the heat could come off the dollar for a while, with the worst news regarding it now in the public domain.
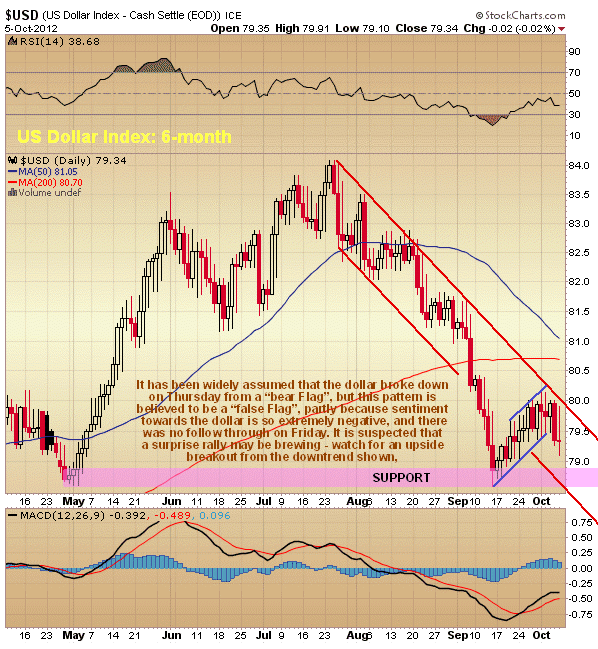
Bearing all the above in mind we will look now at the latest 6-month dollar index chart where the dollar apparently broke down from a bear Flag on Thursday, a development that on the face of it portends another steep drop similar in magnitude to the one preceding the Flag. There are several reasons why this scenario is unlikely, however. The first is that dollar sentiment is already abysmally low, as mentioned above - at levels that are indicative of a bottom. The second is that the Commercials now have massive short positions in gold and immense short positions in silver, which means that there is a high probability that they are about to plunge, and that is hardly likely to happen with the dollar dropping hard. Still another reason is that the dollar is close to strong support visible on its 3-year chart - the neckline of the potential Head-and-Shoulders top. All of this suggests that the bear Flag that has formed in the dollar over the past several weeks is a "False Flag", to borrow a term in use by conspiracy theorists, and if it is, the dollar could suddenly take off strongly higher, breaking out of the downtrend shown on the 6-month chart, which sentiment readings certainly indicate is on the cards. Needless to say, a dollar upside breakout here would be a nasty shock to many committed dollar bears and can be expected to take the wind out of gold and silver's sails, leaving them vulnerable to a wave of heavy profit taking.
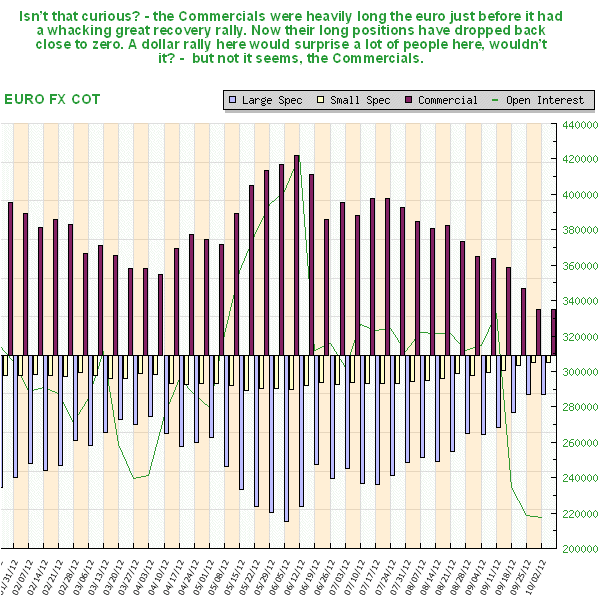
The following COT chart for the Euro FX reveals that the Commercials were heavily long the euro before its whacking great recovery rally of recent months, when of course the media were full of doom and gloom, but now their enthusiasm for the euro has vanished, which means that they have transferred it to the dollar.
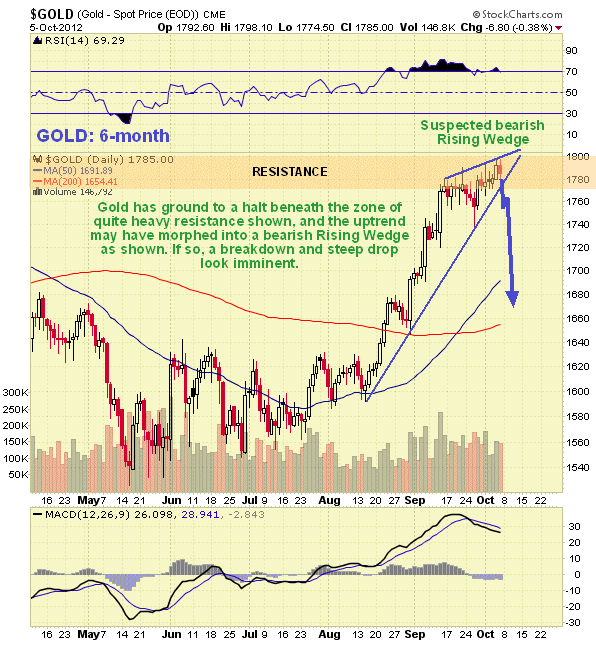
Turning now at last to gold itself, its 6-month chart shows how it has stalled out at a resistance level in recent weeks with the uptrend looking like it has morphed into a bearish Rising Wedge, and with the pattern rapidly closing up, breakdown may be imminent. It is recognized that the sideways movement of the past couple of weeks has allowed the short-term overbought condition to partially unwind, and that this has theoretically restored upside potential, but for various reasons, including the convergence of the channel just mentioned, breakdown is instead looking imminent. The candlesticks with long upper shadows that have appeared over the past couple of weeks are bearish in purport, and are another indication of impending breakdown.
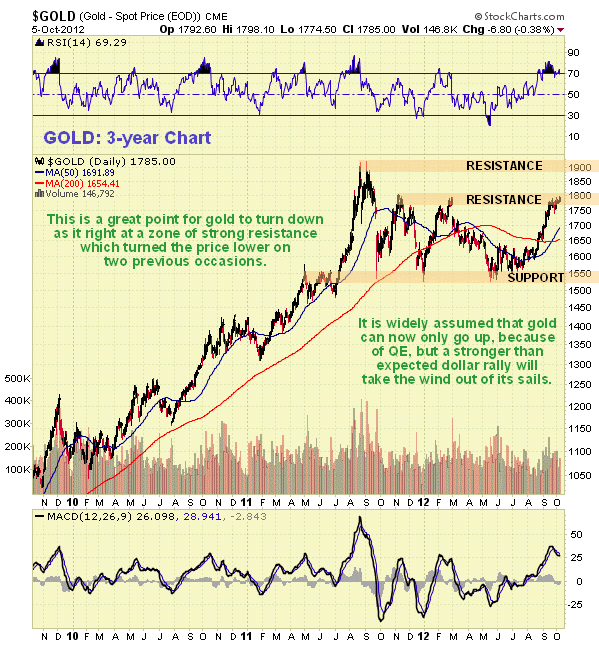
The 3-year gold chart shows the origins of the resistance that has capped its advance in recent weeks. It can be traced back to the significant reversals that occurred in November of 2011 and late in February this year at about this level. Overall, however, gold does not look bad at all on its 3-year chart, and while it does look set to be subjected to a possibly severe correction in coming weeks, perhaps stretching out to a month or two, it should then turn up again to continue with a major long-term uptrend as the unseemly fiat race to the bottom intensifies.
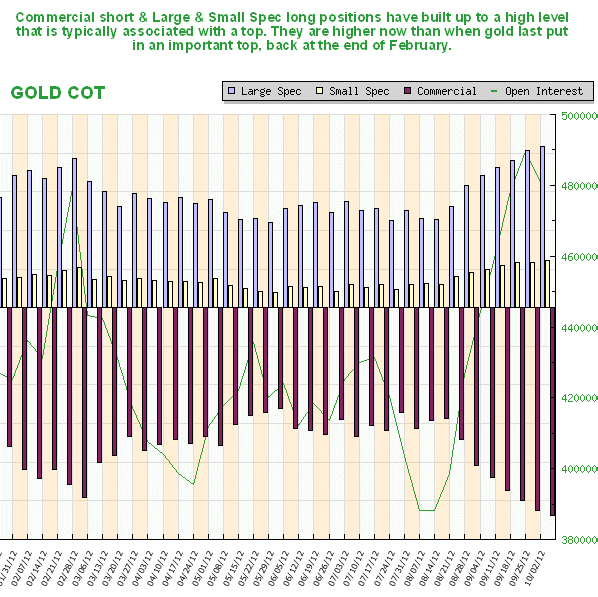
The latest gold COT chart shows how Commercial short and Large and Small Spec long positions have swelled to a high level that makes a reversal and significant correction very probable over the short to medium-term. These levels substantially exceed those reached late last February, prior to the severe downtrend that followed.
To conclude, gold looks set up for a possibly sharp drop soon. More sophisticated traders who examine the 6-month chart for gold presented here will clock the massively advantageous risk/reward ratio for gold shorts at this point, since any newly opened short positions can be protected with an overhead closing stop that strictly limits losses if gold breaks higher, placed just above the top line of the Rising Wedge.
On the site we will be looking at ways to capitalize on the expected drop before Monday's open.
By Clive Maund
CliveMaund.com
For billing & subscription questions: subscriptions@clivemaund.com
© 2012 Clive Maund - The above represents the opinion and analysis of Mr. Maund, based on data available to him, at the time of writing. Mr. Maunds opinions are his own, and are not a recommendation or an offer to buy or sell securities. No responsibility can be accepted for losses that may result as a consequence of trading on the basis of this analysis.
Mr. Maund is an independent analyst who receives no compensation of any kind from any groups, individuals or corporations mentioned in his reports. As trading and investing in any financial markets may involve serious risk of loss, Mr. Maund recommends that you consult with a qualified investment advisor, one licensed by appropriate regulatory agencies in your legal jurisdiction and do your own due diligence and research when making any kind of a transaction with financial ramifications.
Clive Maund Archive |
© 2005-2022 http://www.MarketOracle.co.uk - The Market Oracle is a FREE Daily Financial Markets Analysis & Forecasting online publication.