


Trading Markets - Elliott Wave Pattern that Signals the Start of Opportunity
InvestorEducation / Elliott Wave Theory Oct 16, 2012 - 02:58 AM GMTBy: EWI

 On Monday Oct. 8 I sat down with Elliott Wave International's senior analyst Jeffrey Kennedy to discuss his favorite wave pattern of all: the Elliott wave diagonal.
Nico Isaac: You say if you had to pick just ONE of all 13 known Elliott wave structures to spend the rest of your technical trading life with, it would be the Elliott wave diagonal. First, tell us what the diagonal is.
Jeffrey Kennedy: The diagonal is a five-wave pattern labeled 1 through 5, in which each leg subdivides into three smaller waves: 3-3-3-3-3. Unlike motive waves, however, diagonals are the only five-wave structures in the direction of the main trend in which wave 4 almost always moves into the price territory of wave 1.
.jpg)
Nico: So, what makes this pattern so darn special?
Jeffrey: As you can see in the above charts, the diagonal is a terminating pattern. They can only occur in waves 5 of impulses or C-waves of corrections. This is why they're so exciting. Diagonals precede a dramatic change in trend. And, when they end, prices tend to retrace the entire pattern, or more, and fast. Put simply: If you see a diagonal, you know it's soon time to "look up above" or "out below!"
Nico: Could you give us a real-world example?
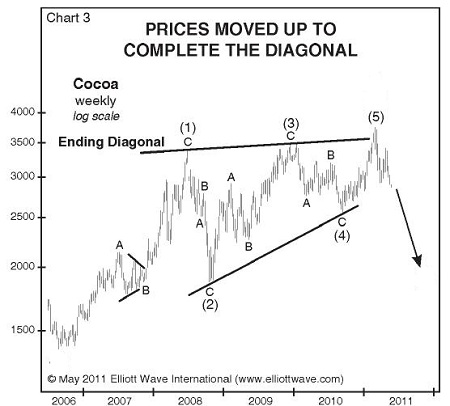
Jeffrey: Sure. Let's go back to the May 2011 Monthly Futures Junctures. In the "Featured Market" segment of that publication, I presented the following chart of cocoa that showed a complete multi-year ending diagonal wave pattern and wrote:
"Another piece of evidence that forewarns of an acceleration in recent selling is the larger operative diagonal pattern... This suggests that cocoa prices will continue this year's sell off for many more months."
Nico: And then what happened?
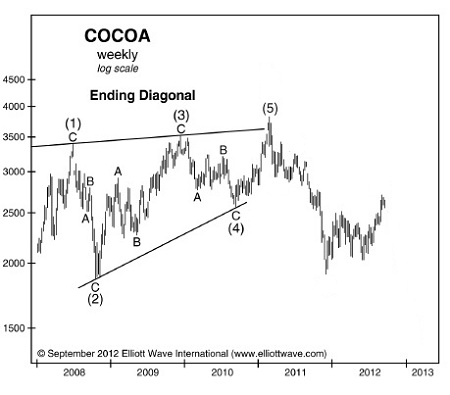
Jeffrey: Take a look at this AFTER chart: Cocoa prices sold off to a 3-year low as they were nearly cut in half -- the sharp manner characteristic of post-diagonal moves:
Nico: Thank you so much for taking the time to explain the ins and outs of your favorite structure, the diagonal.
|
Learn the Benefits of Elliott Waves, One Pattern at a Time Elliott Wave Patterns -- a new FREE educational feature from Elliott Wave International -- gives you basic lessons and videos clips which explain individual patterns, their rules and guidelines. Real-life examples show you how each pattern fits into the overall wave structure. New patterns will be added periodically, so check back often. |
This article was syndicated by Elliott Wave International and was originally published under the headline An Elliott Wave Pattern that Signals the Start of Opportunity. EWI is the world's largest market forecasting firm. Its staff of full-time analysts led by Chartered Market Technician Robert Prechter provides 24-hour-a-day market analysis to institutional and private investors around the world.
About the Publisher, Elliott Wave International
Founded in 1979 by Robert R. Prechter Jr., Elliott Wave International (EWI) is the world's largest market forecasting firm. Its staff of full-time analysts provides 24-hour-a-day market analysis to institutional and private investors around the world.
© 2005-2022 http://www.MarketOracle.co.uk - The Market Oracle is a FREE Daily Financial Markets Analysis & Forecasting online publication.