


Stock Market Downtrend Continues
Stock-Markets / Stock Markets 2012 Oct 30, 2012 - 11:59 AM GMTBy: Tony_Caldaro

 The market continued to correct this week, as it has for most of October. After starting the week at SPX 1433, it quickly dropped to 1408 by early tuesday morning. Then for the rest of the week the market tried to rally but ended with a slightly lower low every day, right into friday. For the week the SPX/DOW were -1.65%, and the NDX/NAZ were -0.55%. Asian stocks lost 1.0%, European stocks lost 1.7%, and the DJ World index was -1.7%. On the economic front things continue to improve: positive reports outpaced negative ones 6 to 3. On the downtick: consumer sentiment, new home prices and the WLEI. On the uptick: new/pending home sales, FHFA housing prices, durable goods orders, Q3 GDP and weekly jobless claims declined. While this week’s market action was mostly technical due to the lack of economic reports. Next week the will likely be all about the economy. The monthly Payrolls report highlights the week, with Auto sales and the Chicago PMI.
LONG TERM: bull market
While recent corporate earnings reports have been rather flat, we have been observing a pick up in the economy over the past several months. This week’s Q3 GDP report, (+2.0% vs +1.3%), added some support to our observations. This bull market has displayed seasonal tendencies as it has unfolded. Q2 has consistently created a market peak followed by a correction. While Q4 has consistently created a short/medium term low followed by a new/continued uptrend. This Q4 was no exception.
This bull market continues to unfold in clear Elliott waves in the DOW, but not so in the SPX. It appears the market’s objective is to keep as many as possible on the sidelines, or looking for a bear market, while the bull market unfolds. This phenomenon has been most noticeable in Q2 and Q4 of this year. Both times the SPX failed to make a new print high during a fifth wave, while the DOW did not. Whether, or not, this continues into 2013 is yet to be seen. Nevertheless, the market’s message is clear: the DOW is the bellwether index for the US market.
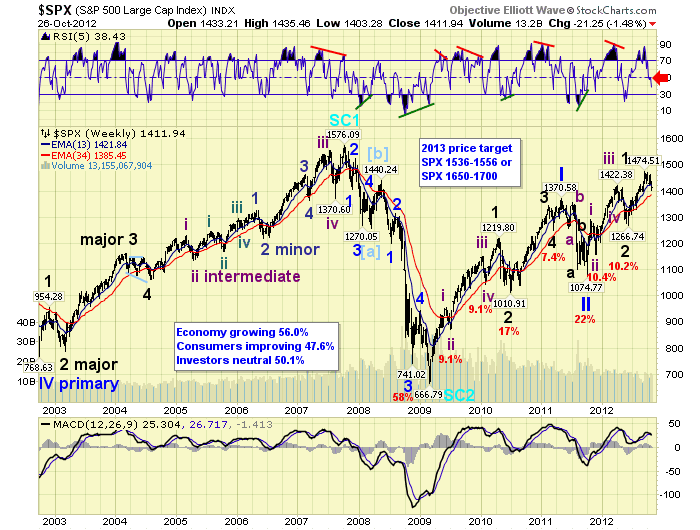
Our weekly chart continues to display the 2002-2007 bull market, the 2007-2009 bear market, and the current bull market from 2009. Since we counted the Mar 2009 low as a completed Supercycle wave zigzag. We have been anticipating a five Primary wave, Cycle wave [1] bull market to kickoff the next Supercycle wave. Thus far, Primary waves I and II completed at SPX 1371 and SPX 1075 in 2011. And, Primary wave III has been underway since that low. Primary wave I divided into five Major waves, with a subdividing Major wave 1. And, Primary wave III appears to be following the same path. Thus far, Major wave 1 subdivided into five Intermediate waves concluding in Q2 of 2012 at SPX 1422/17. Then after a Major wave 2 correction to SPX 1267, Major wave 3 began. There is now technical evidence that Major wave 3 will also subdivide into five Intermediate waves. We are carrying this count on the DOW charts. When the current correction concludes we will have a more precise idea of the most probable wave count.
MEDIUM TERM: downtrend likely underway
The recent uptrend began in early June at the Major wave 2 low. The uptrend progressed, in five waves, into early October in the DOW. The SPX failed by just five points to make a higher high at that time. The Tech indices, NDX/NAZ, topped in September and have been downtrending since then. Since the NDX/NAZ topped earlier they have been leading the Cyclical SPX/DOW lower.
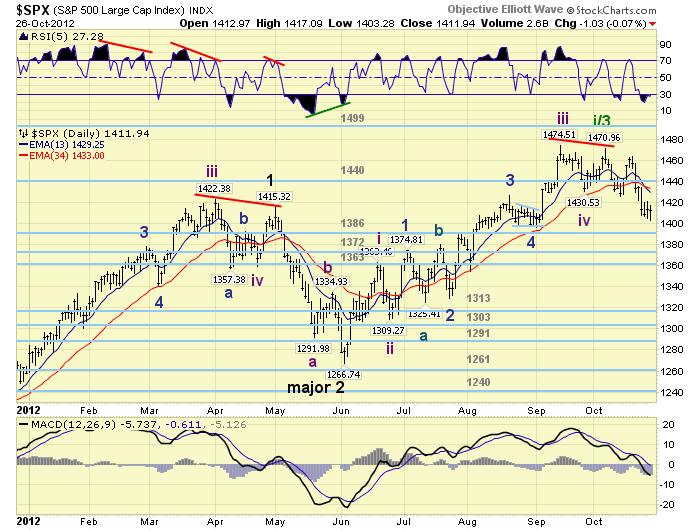
We have been counting this decline, from the early October SPX 1471 high, as a simple ABC. Wave A SPX 1471-1426, wave B to 1464, and wave C still underway into the friday’s low of 1403. Since the recent uptrend ended with a weak fifth wave, it created the possibility of a fairly steep correction: a 50% to 61.8% retracement. Thus far this has not occurred as the SPX is down less than 5%.
Last weekend we posted some Fibonacci/retracement levels suggesting important support levels for this correction. At SPX 1391/93, we will have a 38.2% retracement of the uptrend and wave C = 1.618 wave A. Then SPX 1369 represents a 50.0% retracement, and SPX 1345/46 a 61.8% retracement with wave C = 2.618 A. Since the first two of the levels, SPX 1391/93 and SPX 1368, are within the range of the OEW 1386 and 1363 pivots we will default to the pivots as support. Medium term support remains at the 1386, 1372 and 1363 pivots, with resistance at the 1440 and 1499 pivots.
SHORT TERM
Short term support is at SPX 1402/03 and 1396/98, with resistance at SPX 1413/16 and 1422/27. Short term momentum ended the week just above neutral. The short term OEW charts remain negatively biased from SPX 1448, with the swing level now around 1423.
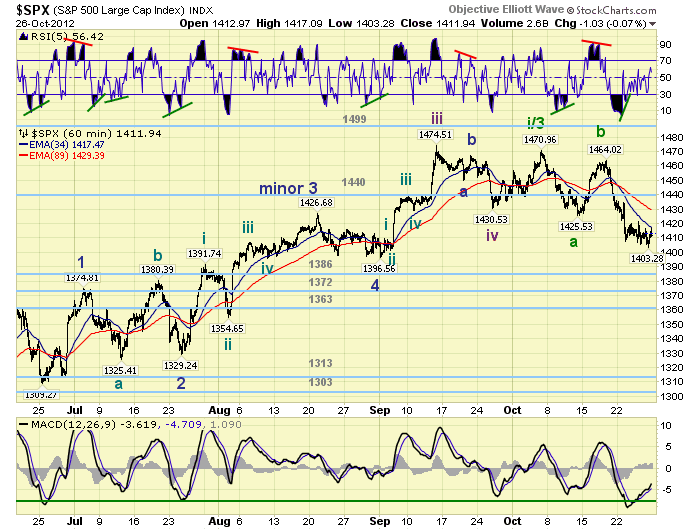
The internal wave structure of the ABC decline from SPX 1471 is a bit difficult to interpret. One view of wave A suggests it was five waves down, and another view suggests it was a smaller abc. Wave C is even more complex. As a result of this short term complexity we need to rely more on the daily and weekly charts. And, of course, the OEW pivots.
Currently the weekly RSI is sufficiently oversold to start looking for a low. Previous Intermediate wave ii lows have occurred just below the current level. The daily RSI is currently in oversold territory. But the MACD could drop a bit further, suggesting a possible low as early as next week. With the SPX closing at 1412 on friday, one more push down into possibly the OEW 1386 pivot range could do it. Best to your trading!
FOREIGN MARKETS
The Asian markets were mostly lower on the week for a net loss of 1.0%. China and Japan remain in confirmed downtrends, but S. Korea looks quite weak.
The European market were mostly lower as well for a net loss of 1.7%. France, Germany, Italy, Spain and the STOX index all look weak.
The Commodity equity group were all lower on the week for a net loss of 2.6%. All three indices, Brazil, Canada and Russia look quite weak.
The DJ World index also looks weak and lost 1.7% on the week.
COMMODITIES
Bonds have remained in a choppy downtrend pattern since their peak in early June. Bonds gained 0.1% on the week and 10yr yields declined 18 basis point to 1.75%.
Crude continues to downtrend losing 4.8% on the week. The next support level looks like $83.65.
Gold continues to decline from the early October $1798 high. The next support appears to be around $1675.
The USD appears to be uptrending from the September DXY 78.60 low. It gained 0.6% on the week.
NEXT WEEK
A busy economic week ahead. Monday: Personal income/spending and PCE prices at 8:30. Tuesday: Case-Shiller and Consumer confidence. Wednesday: the ADP index and Chicago PMI. Thursday: weekly Jobless claims, ISM manufacturimg, Construction spending, and Auto sales. Friday: the Payrolls report and Factory orders. One speech on the schedule for the FED. On friday FED governor Tarullo speaks at Yale. Best to your weekend and week!
CHARTS: http://stockcharts.com/...
http://caldaroew.spaces.live.com
After about 40 years of investing in the markets one learns that the markets are constantly changing, not only in price, but in what drives the markets. In the 1960s, the Nifty Fifty were the leaders of the stock market. In the 1970s, stock selection using Technical Analysis was important, as the market stayed with a trading range for the entire decade. In the 1980s, the market finally broke out of it doldrums, as the DOW broke through 1100 in 1982, and launched the greatest bull market on record.
Sharing is an important aspect of a life. Over 100 people have joined our group, from all walks of life, covering twenty three countries across the globe. It's been the most fun I have ever had in the market. Sharing uncommon knowledge, with investors. In hope of aiding them in finding their financial independence.
Copyright © 2012 Tony Caldaro - All Rights Reserved Disclaimer: The above is a matter of opinion provided for general information purposes only and is not intended as investment advice. Information and analysis above are derived from sources and utilising methods believed to be reliable, but we cannot accept responsibility for any losses you may incur as a result of this analysis. Individuals should consult with their personal financial advisors.
© 2005-2022 http://www.MarketOracle.co.uk - The Market Oracle is a FREE Daily Financial Markets Analysis & Forecasting online publication.