


Stock Market Scenarios for the Week Ahead
Stock-Markets / US Stock Markets Feb 17, 2008 - 09:13 AM GMTBy: Mike_Paulenoff

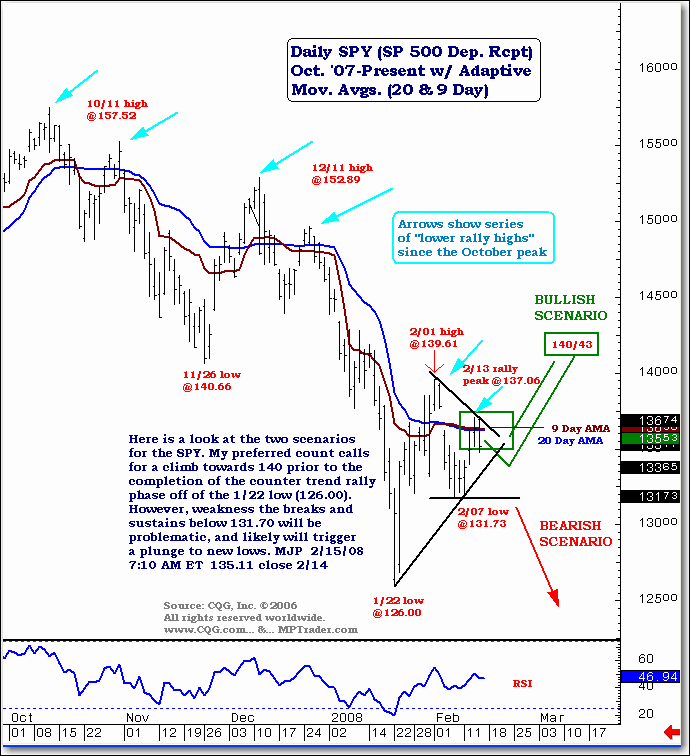
 Here is a look at the two scenarios for the SPY -- the S&P 500 ETF. My
preferred count calls for a climb towards 140 prior to the completion of the
countertrend rally phase off of the January 22 low (126.00). However,
weakness that breaks and sustains below 131.70 will be problematic and
likely will trigger a plunge to new lows.
Here is a look at the two scenarios for the SPY -- the S&P 500 ETF. My
preferred count calls for a climb towards 140 prior to the completion of the
countertrend rally phase off of the January 22 low (126.00). However,
weakness that breaks and sustains below 131.70 will be problematic and
likely will trigger a plunge to new lows.
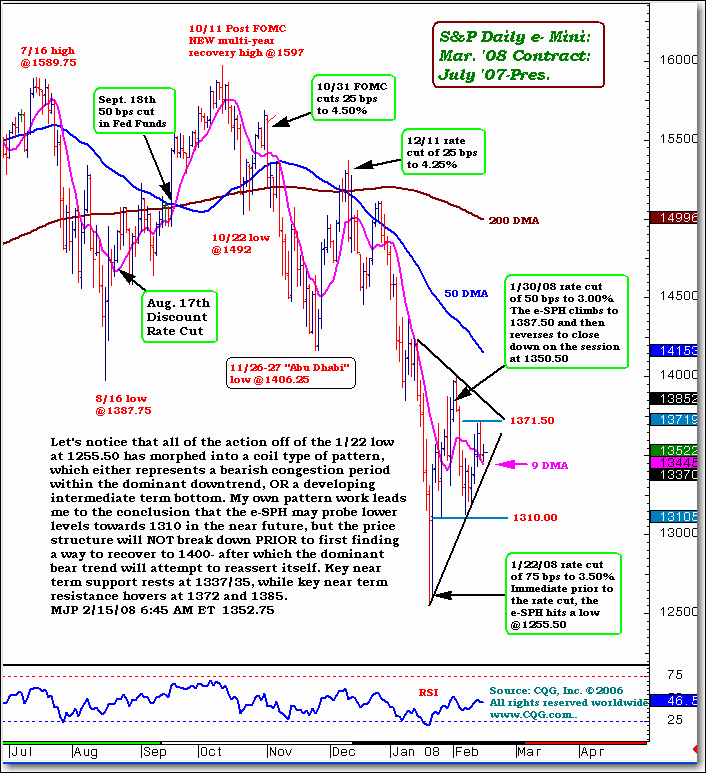
A look at the daily chart of the S&P 500 E-mini futures index helps support this analysis. Let's notice that all of the action off of the January 22 low at 1255.50 has morphed into a coil type of pattern, which either represents a bearish congestion period within the dominant downtrend, or a developing intermediate-term bottom.
My own pattern work leads me to the conclusion that the e-SPH may probe lower levels towards 1310 in the near future, but the price structure will NOT break down prior to first finding a way to recover to 1400, after which the dominant bear trend will attempt to reassert itself. Key near-term support rests at 1337/35, while key near-term resistance hovers at 1372 and 1385.
Sign up for a free 15-day trial to Mike's ETF Trading Diary today.
By Mike Paulenoff
Mike Paulenoff is author of the MPTrader.com (www.mptrader.com) , a real-time diary of Mike Paulenoff's trading ideas and technical chart analysis of Exchange Traded Funds (ETFs) that track equity indices, metals, energy commodities, currencies, Treasuries, and other markets. It is for traders with a 3-30 day time horizon, who use the service for guidance on both specific trades as well as general market direction
© 2002-2008 MPTrader.com, an AdviceTrade publication. All rights reserved. Any publication, distribution, retransmission or reproduction of information or data contained on this Web site without written consent from MPTrader is prohibited. See our disclaimer.
Mike Paulenoff Archive |
© 2005-2022 http://www.MarketOracle.co.uk - The Market Oracle is a FREE Daily Financial Markets Analysis & Forecasting online publication.
Comments
|
Daewoo
18 Feb 08, 01:10 |
insightful
AAAhhh...so the market will either go up or down as opposed to maintaining a static price for the next week. |