


Could a Bad Stock Market Monday and Tuesday Decide U.S. Presidential Election?
Stock-Markets / Stock Markets 2012 Nov 03, 2012 - 09:58 AM GMT

 The VIX bounced from its 10-week moving average to complete a minor retracement, then closed above its 40-week support at 17.43 this week. A breakout above the inverted Head & Shoulders neckline and mid-Cycle support/resistance at 20.83 announces that a Third Wave is underway with substantially higher targets. Once the initial target is met, VIX has a shot at Cycle Top resistance at 34.02 and possibly much higher.
SPX breaks Ending Diagonal support.
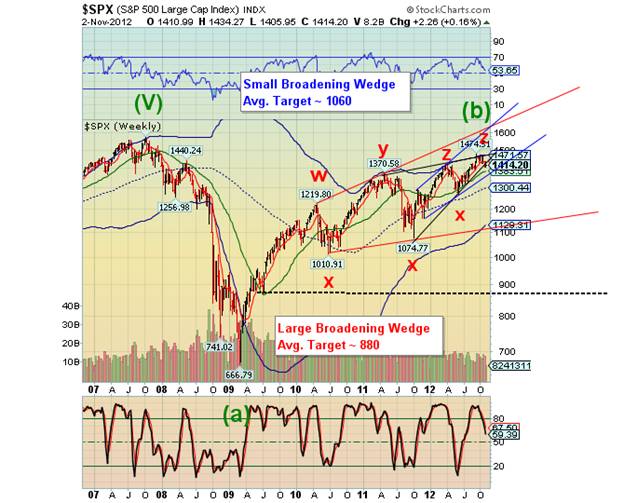
-- SPX broke through its Ending Diagonal trendline at 1418.00 late this week, after retesting it on Friday. This is where the excitement begins. The next possible support is the 40-week moving average at 1383.51. Technicians are beginning to wake up to the fact that a major key support has been broken. The Broadening Top formations lies just beneath, suggesting the decline may be much faster and deeper than normal. There are four potential Broadening Wedges nested within each other that may cause a “pancake effect” as the decline breaks the supports of these formations, one after another. In addition, the extended rallies are delaying major cycle lows that are now long overdue. This could have the effect of compressing an already significant decline into an intense panic situation.
NDX broke beneath its 40-week average.
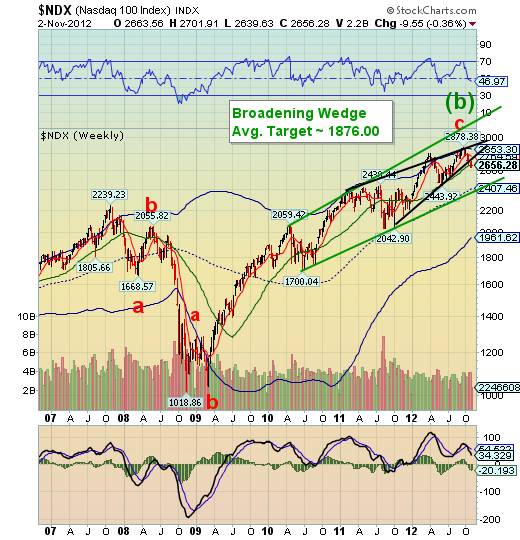
The NDX continues to lead the major indices by breaking its 40-week moving average at 2668.61. What is more, there are no further supports beneath it until mid-Cycle support at 2407.46, where it has the opportunity of breaking its 2 ½ year old Broadening Wedge at the same time. This Broadening Wedge has an average target below Cycle Bottom support at 1961.62.
(ZeroHedge) What a roundtrip!
After starting off November with a bang, and after nearly retracing all October losses in the aftermath of the NFP headfake in less than 2 trading sessions, the S&P futures literally imploded, and dropped 23 points from the intraday high, the same distance traveled as, only to the downside and on very strong volume for the second day in a row.
The Euro also broke key support.
-- The Euro didn’t decline very far, but did itself a lot of serious technical damage as it closed beneath its 10-week moving average at 129.14 and its 40-week moving average at 128.37. It is now ready for its Wile E. Coyote moment as it begins a third wave at three degrees. The following week may see a panic decline in the Euro. This is due to a long-overdue Master Cycle low that is expected at any time.
.The Financial Super-Storm of 2013 (October 31, 2012)
(OfTwoMinds.com) The next "Frankenstorm" to hit New York will be financial.
The destructive whirlwind that hits New York in 2013 will be a financial Frankenstorm.
The US Dollar exceeds its 10-week moving average.
USD broke above its prior highs and closed above its 10-week moving average. It is now ready to take on its 40-week resistance on its way to Cycle Top resistance at 83.80 and a waiting Head & Shoulders neckline. The potential right shoulder of the inverted Head & Shoulders appears finished. Because this pattern is not apparent in the daily charts, there is very little awareness of it and the ramifications of a powerful new trend in the Dollar.
Gold closes below its 10-week support.
-- Gold broke through the lower trendline of its Orthodox Broadening Top, triggering a potential drop to 1324.40. The implications for gold are enormous, since this is a pre-crash pattern. Investor sentiment is off the charts, suggesting there has been virtually no preparation for the panic to come. In addition, there is a complex Head & Shoulders neckline awaiting at 1565.00. Could this be the start of something big???
Treasuries challenge the trendline.
-- USB has spent the week challenging the lower trendline of its 43-month old Ending Diagonal formation and closed just beneath it for no net gain for the week. Ending Diagonals are usually completely retraced, suggesting a decline below its 31-year trendline and a target near Cycle Bottom support at 114.35. This forecasts a massive technical breakdown. A further decline may spark the first flash crash in bonds, which nobody is expecting. See below.
Tear Up the Paper
(ZeroHedge) Total global debt is around $200Tn. World GDP is less than $70Tn (300% global debt to global GDP). Advanced economies have a higher percent of total Debt/GDP then developing countries. So the crux of the problem lies with Japan, most of the EU and the USA.
The question of what to do with all this debt has become a topic of discussion of late. The catalyst was (surprisingly) the IMF. Some deep thinkers at the IMF have resurfaced an old idea. Just cancel the debt; make it disappear.FTAlphaville, Ambrose Pritchard, and Zero Hedge have had articles that discussed the IMF paper.
Crude waiting for Election Week?
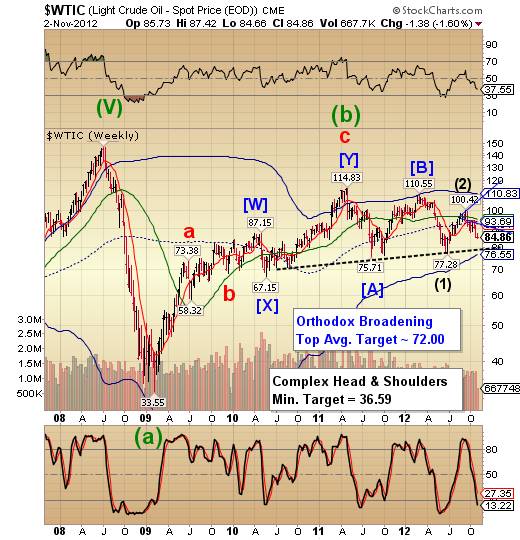
-- West Texas Intermediate Crude seems to be regrouping while waiting for the SPX to get its decline in gear. WTIC is in as bearish position as one can imagine. Not much left, but to finish off what it started. It appears that election week may be the spoiler for WTIC..
China stocks confirm a bullish breakout, despite economic slowdown.
--The Shanghai index has broken above its Bullish Wedge formation and its 10-week moving average support at 2092.06, continuing to distance itself from it. Bullish Wedges are short-term consolidation patterns that have a minimum potential of attaining mid-Cycle resistance at 2548.30. If it can break out above that level, the surprise finding is that it may go the distance to Cycle Top resistance at 3123.56. This is a very reliable pattern and worth sitting through some extra volatility while attaining its goal.
The India Nifty remains above 10-week support.
The India Nifty has tested its 10-week moving average at 5604.19, but remains above it. It is likely to slip below its supports as Japanese, European and US equities make their plunge. The extended Cycle Wave I adds another bearish element to CNXN. A Cup eith Handle formation is now evident, which supports the validity of the Head & Shoulders pattern.
The Bank Index still testing supports.
-- Despite its bullish appearance, BKX has not made a new high since September 14, more than six weeks ago. It remains above its 10-week moving average at 49.91 and mid-Cycle support at 46.23. However, the extended correction now puts an even more bearish Cup with Handle in play. Talk about unintended consequences!
(ZeroHedge) The problem with the Fed starts with a basic, very favorable disposition to large banks. This love affair stems from monetary policy, which is the main focus of all Fed officials. The neo-Keynesian socialism that passes for mainstream thinking at the US central bank assumes that large financial institutions are more stable than smaller players, especially since the functioning of the government debt markets is paramount.
Readers of Zero Hedge know well that one of the most abhorred (by us) accounting gimmicks employed by banks each and every quarter over the past 3 years to boost their bottom line, is to engage in loan-loss reserve releases: a process which has absolutely no associated cash flow benefit, but merely boosts EPS for GAAP purposes. In some cases, like this quarter's absolutely farcical JPM earnings release, the abuse is beyond the pale, as the offending bank releases reserves even as it reports surging non-performing loans: two processes which in a normal world can not coexist.
We end on that note.
Regards,
Tony
Our Investment Advisor Registration is on the Web
We are in the process of updating our website at www.thepracticalinvestor.com to have more information on our services. Log on and click on Advisor Registration to get more details.
If you are a client or wish to become one, please make an appointment to discuss our investment strategies by calling Connie or Tony at (517) 699-1554, ext 10 or 11. Or e-mail us at tpi@thepracticalinvestor.com .
Anthony M. Cherniawski, President and CIO http://www.thepracticalinvestor.com
As a State Registered Investment Advisor, The Practical Investor (TPI) manages private client investment portfolios using a proprietary investment strategy created by Chief Investment Officer Tony Cherniawski. Throughout 2000-01, when many investors felt the pain of double digit market losses, TPI successfully navigated the choppy investment waters, creating a profit for our private investment clients. With a focus on preserving assets and capitalizing on opportunities, TPI clients benefited greatly from the TPI strategies, allowing them to stay on track with their life goals
Disclaimer: The content in this article is written for educational and informational purposes only. There is no offer or recommendation to buy or sell any security and no information contained here should be interpreted or construed as investment advice. Do you own due diligence as the information in this article is the opinion of Anthony M. Cherniawski and subject to change without notice.
Anthony M. Cherniawski Archive |
© 2005-2022 http://www.MarketOracle.co.uk - The Market Oracle is a FREE Daily Financial Markets Analysis & Forecasting online publication.