


Stock Market Downtrend May be Bottoming
Stock-Markets / Stock Markets 2012 Nov 04, 2012 - 01:39 PM GMTBy: Tony_Caldaro

 The US trading week began on pause, as exchanges were closed ahead of the expected Hurricane Sandy. Weather forecasters probably saved thousands of lives as they correctly anticipated the westward turn of Superstorm Sandy into the east coast. Kudos to them! As a result of the storm the NYSE was closed for four straight days, for the first time since the Blizzard of 1888. After a quiet opening on wednesday, the market surged on thursday (the first day of the month), and then gave it all back on friday. For the week the SPX/DOW were mixed, and the NDX/NAZ were -0.3%. Asian markets gained 0.8%, European markets gained 0.5%, and the DJ World index rose 0.6%. On the economic front positive reports outnumbered negative reports 13 to 3. On the downtick: the monetary base, the WLEI and the unemployment rate rose. On the uptick: personal income/spending, PCE prices, ISM manufacturing, Case-Shiller, the Chicago PMI, the ADP index, construction spending, auto sales, the monthly payrolls report, consumer confidence, factory orders, and weekly jobless claims declined. Next week we will get reports on ISM services, Consumer sentiment and Consumer credit.
LONG TERM: bull market
For the past few months we have observed the economy improving week after week, while the stock market has rallied and recently corrected. While the stock market has remained in a long term wave pattern since the spring of 2009. The economy, however, has had several starts and stops during this period. Recently the economy has been improving since the fall of 2011. This is exactly when Primary wave II bottomed in the stock market. Until we observe a 47% reading, or lower, on the WLEI, (it’s currently 55.9%), we expect the economy to continue to grow.
We have been counting this bull market as Cycle wave [1]. These types of bull markets unfold in five Primary waves. Primary waves I and II completed in 2011, and Primary wave III has been underway since that low. Primary wave I divided into five Major waves with a subdivided Major wave 1. Primary wave III appears to be following a similar path, as Major 1 has also subdivided in five Intermediate waves. Major wave 3, however, also appears to be subdividing into five Intermediate waves as well.
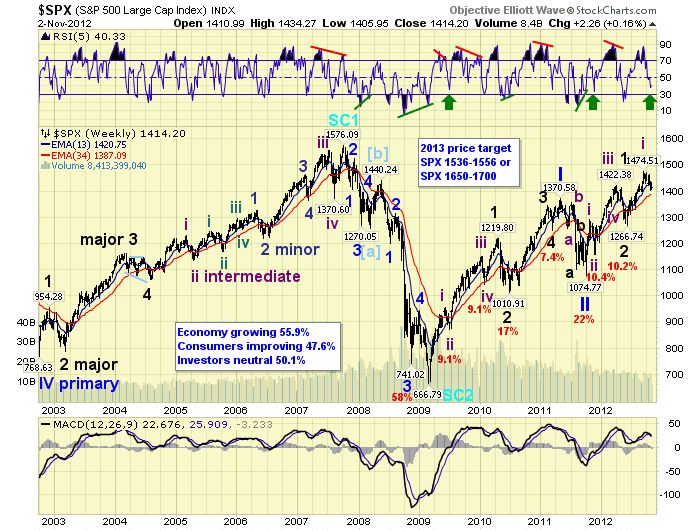
The weekly chart displays this entire pattern, and the bull/bear wave patterns that preceeded it. The weekly MACD continues to display typical bull market characteristics: remaining above neutral most of the time. The weekly RSI is bullish as well, with extremely overbought reading during uptrends and barely oversold during downtrends. Currently the RSI is quite close to the typical oversold level, for Intermediate wave ii’s, during this bull market. This is noted by the green arrows. The bull market remains on track.
MEDIUM TERM: downtrend
For the past few weeks we have observed a downtrend unfold in the four major indices. This downtrend is likely to be Intermediate wave ii of Major wave 3. The DOW completed a nice five waves up from early June into its October uptrend high. The SPX, however, displayed another fifth wave failure during its uptrend. Reaching a wave 3 high at SPX 1475, then a wave 5 high at 1471. This is the second fifth wave failure in a row for the SPX. This may be a characteristic of Primary wave III. Keep in mind the DOW is the bellwether index, and the SPX is the traders index.
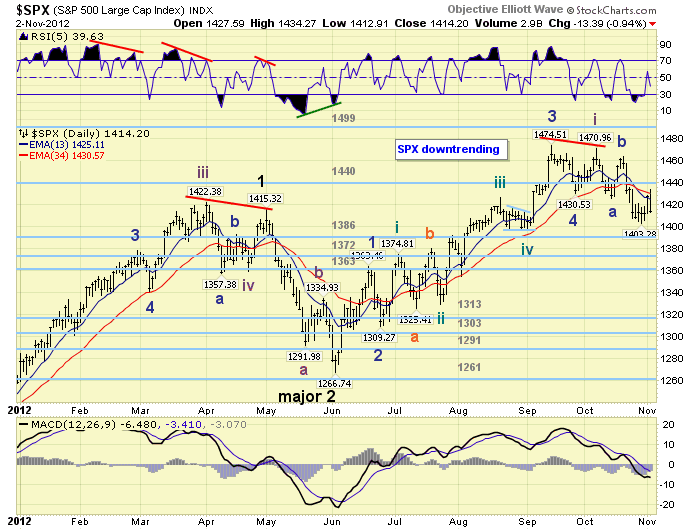
After the SPX topped at 1471 it started what appears to be an ABC downtrend. Wave A declined to SPX 1426, wave B rallied to SPX 1464, and wave C has thus far declined to 1403. As we have noted before, wave A could have been counted as a three or a five. With this in mind it made it a bit difficult to anticipate the wave structure of wave C. After this week’s activity it appears the short term count has finally cleared up. More on this in the short term section.
While the downtrend was underway we made some calculations for Fibonacci wave relationships, and downtrend retracement levels. We arrived with three levels. First at the OEW 1386 pivot range, (1379-1393), wave C = 1.618 wave A and represents a 38.2% retracement of Intermediate wave i. Next is the OEW 1363 pivot range, (1356-1370), which represents a 50% retracement. Then SPX 1345/46 which represents a 61.8% retracement, and where wave C = 2.618 wave A. Currently we are expecting the OEW 1386 pivot level to provide support for this downtrend. This correction has already unfolded for about one month with less than a 5% decline. Usually steeper corrections, of this degree, decline quite rapidly in the same period of time. Medium term support remains at the 1386 and 1372 pivots, with resistance at the 1440 and 1499 pivots.
SHORT TERM
Short term support is at SPX 1413/16 and SPX 1402/03, with resistance at SPX 1422/27 and the 1440 pivot. Short term momentum ended the week quite oversold. The short term OEW charts flipped up and down this week, ending negatively biased, with the swing level now at SPX 1422.
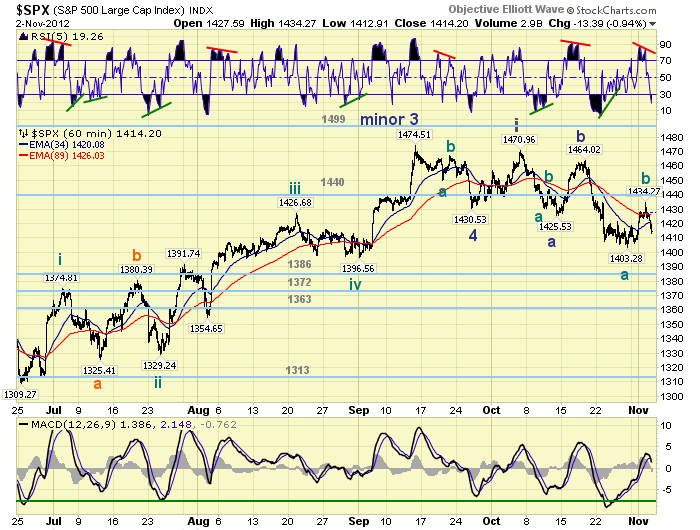
The internal wave structure of this Intermediate wave ii correction has been a bit tricky to decipher. After this week’s market activity the structure is beginning to look a bit clearer. The first decline, wave A, appears to be an abc within itself: SPX 1431-1444-1426. Then there was a B wave rally. This second decline, wave C, also appears to be dividing into an abc: SPX 1403-1434-and now c of C underway. This suggests either a retest of support at SPX 1402/03, a slightly lower low at SPX 1396/98, or a drop to the OEW 1386 pivot range. Whatever the actual outcome, it is most likely to occur this week. Best to your trading!
FOREIGN MARKETS
The Asian markets were mostly higher on the week for a net gain of 0.8%. Japan, S. Korea and Singapore are currently in confirmed downtrends.
The European markets were nearly all higher for a net gain of 0.5%. France, Germany, Italy, Spain and the STOX are currently all in confirmed downtrends.
The Commodity equity group were mixed for a net gain of 0.8%. Brazil and Russia are in confirmed downtrends.
The DJ World index is downtrending but was higher on the week for a gain of 0.6%.
COMMODITIES
Bonds are now uptrending, but still choppy, and gained 0.2% on the week.
Crude remains in its two month downtrend losing 1.6% on the week. A positive divergence may be setting up shortly.
Gold tumbled on friday, remains in a downtrend, and lost 2.0% on the week.
The USD is now uptrending and gained 0.7% on the week.
NEXT WEEK
On monday we have ISM services at 10:00. Tuesday: Election day. Wednesday: Consumer credit. Thursday: weekly Jobless claims and the Trade deficit. Then on friday: Consumer sentiment, Export/Import prices and Wholesale inventories. The ECB meets on thursday, with a press conference to follow. The FED has nothing scheduled. Best to your week!
CHARTS: http://stockcharts.com/...
http://caldaroew.spaces.live.com
After about 40 years of investing in the markets one learns that the markets are constantly changing, not only in price, but in what drives the markets. In the 1960s, the Nifty Fifty were the leaders of the stock market. In the 1970s, stock selection using Technical Analysis was important, as the market stayed with a trading range for the entire decade. In the 1980s, the market finally broke out of it doldrums, as the DOW broke through 1100 in 1982, and launched the greatest bull market on record.
Sharing is an important aspect of a life. Over 100 people have joined our group, from all walks of life, covering twenty three countries across the globe. It's been the most fun I have ever had in the market. Sharing uncommon knowledge, with investors. In hope of aiding them in finding their financial independence.
Copyright © 2012 Tony Caldaro - All Rights Reserved Disclaimer: The above is a matter of opinion provided for general information purposes only and is not intended as investment advice. Information and analysis above are derived from sources and utilising methods believed to be reliable, but we cannot accept responsibility for any losses you may incur as a result of this analysis. Individuals should consult with their personal financial advisors.
© 2005-2022 http://www.MarketOracle.co.uk - The Market Oracle is a FREE Daily Financial Markets Analysis & Forecasting online publication.