


Weekly Gold Chart Has A Lot To Reveal. Market Activity Rules!
Commodities / Gold and Silver 2012 Nov 12, 2012 - 04:48 AM GMTBy: Submissions

 Michael Noonan writes: Our sole basis for understanding what little we may know of the market comes directly
from the most reliable source, the market itself. The basis for any market derives from the forces of supply and demand. In futures, battles and results from those two opposing dynamics are to be found in price, volume, and time. Our contention is that the markets have their own degree of logic, and patience in reading charts can be very revealing, ultimately rewarding.
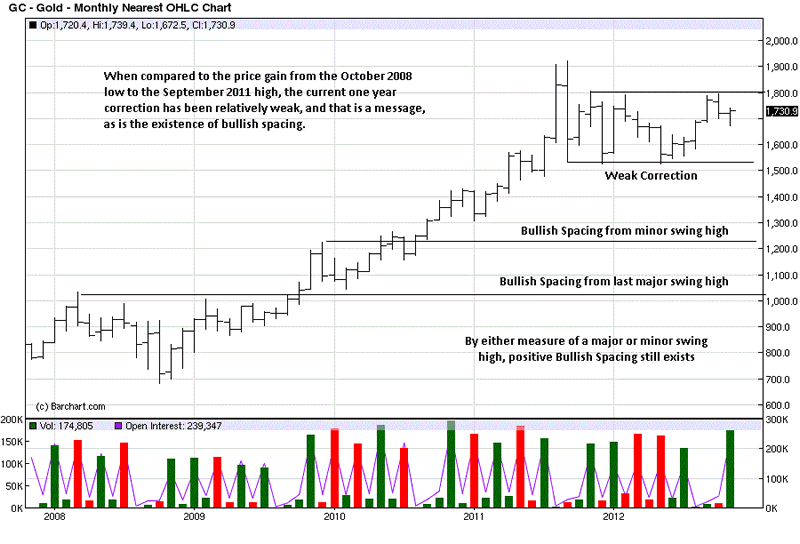
The weekly chart has a lot to say, as we read it, and a discussion on it will be covered, at length, for we believe it is stage-setting for what is to come. We start with the monthly.
Bullish spacing has been covered in many of our past charts. It exists when the current swing low is above the last swing high, leaving a space between them. What makes it bullish is the statement made from buyers. They are willing to buy into the market at current higher levels without waiting to see if a retest of the last high area will hold. The same holds true in a declining market, where the last swing high remains below the last swing low, leaving behind what would be bearish spacing.
This spacing is background to a more pertinent observation, and that is the relative weakness of the current trading range since the September 2011 high. The give-back in price has been relatively small when compared to the ground gained since the October 2008 low. It is this higher swing low[s] that leaves behind bullish spacing, and the degree of spacing is quite large, another way of re-enforcing the existence of a weak correction.
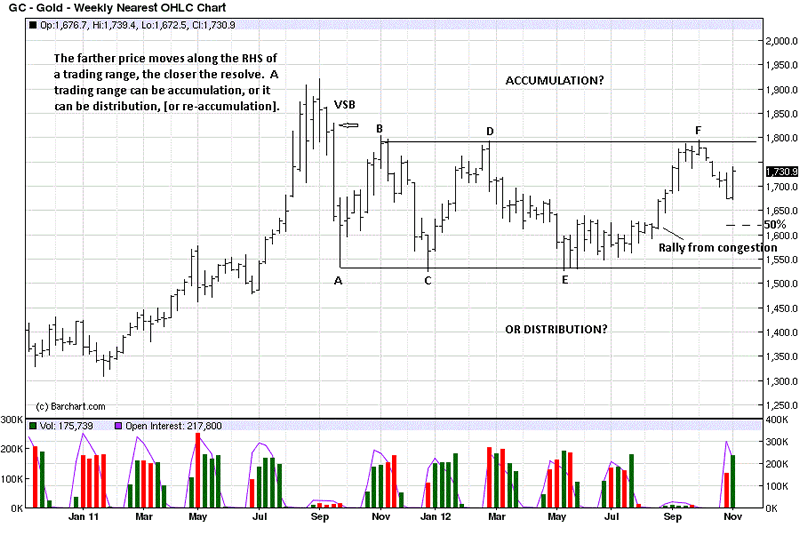
The weekly shows much more detail, and upon going over several observations in preparation for this commentary, we were taken with how revealing the overall points lead to such a positive outlook, not because of any collective opinions one can read, anywhere, but from reading the price, volume, and time factors produced every day by the market.
A trading range reflects a balance between buyers and sellers jockeying for position. It can be accumulation, in preparation to go higher; distribution, in preparation to go lower, or it can be re-accumulation, after a correction, preparing to go higher.
We marked the second bar, after the high, “VSB,” or Vertical Supply Bar. It shows price accelerating to the downside, most often on increased volume, or Supply entering the market. The bar itself will be resistance, sometime in the future, when price tries to rally to or above it, and sellers defend the area where they went short, protecting their position.
After the low at “A,”, price had a retest rally, [a retest of the high], that stopped at “B.”
Note the close above bar “A.” It is in the upper range of the bar. The market is telling us that buyers were stronger than sellers, at that level, despite an almost $400 decline. We can reference this at some point in the future, just as we can reference the VSB. As it turns out, the rally to “B” stopped just short of the high of the VSB, where sellers were defending their previous activity, and this led to another decline.
Here, the market is revealing important information. It confirmed that the VSB would be defended by sellers, and the rally stopping at “B” and then declining tells us to expect that a trading range may develop. If you cover up all the activity after point “B,” you would not know that a trading range was likely to follow, but a read of market activity, up to that point would have you prepared for one. Why?
Very often, when there is an unusually large range bar, [it works whether up or down], price then tends to stay with that bound, as a trading range. This is why we pointed out the VSB, for what it implies, and the upper range closing of the bar above “A,” and what
it implies. Putting the two together, we can look for a trading range to follow between their combined high and low. Uncover the activity after point “B,” and what do you see? The market does advertise its intent on so many occasions.
Correction “B to C” erases the entire rally “A to B,” but look where it stops. Further, note the location of the close on the bar above “C.” Relatively similar to the close above bar “A,”
would you not agree? Bear in mind, what we are doing is gathering observable facts, not opinions, to see if there is a message. We can add yet another small detail here, and there may be more than we are addressing.
The low, at “C,” went just under the strong sell-off low at “A.” We can conclude from the close at level “A” low that the strength of the sell-off from then all-time high was tempered by the location of that close. The new FACT that the low at “C” was barely lower than “A”
gives us two more pieces of information. One, there were no resting sell-stops under the previous low, unusual, and two, there were no willing sellers to press the market at what would have been new lower levels. If there are no sell-stops and no more willing sellers, then what can we expect the market to do? Rally “C to D” develops.
Where does rally “D” stop? Just below the previous high at “B.” Sellers overwhelmed buyers and pushed price lower, again. But wait, didn’t we already determine that we could likely see a trading range develop? Isn’t that where the rally stopped, to create and extend a developing trading range and validate the VSB, made months earlier? It was developing market activity, factual observations that are not subject to dispute, which provided us, months in advance, with a potential blue print? There is more.
Where does decline “D to E” stop? We already gave what happened at “A,” supported with new information that developed at “C,” that now points to potential expectations for what could happen, and does, at “E.” Again, note the location of the close above bar “E,” at the top of the range, telling us that in apparent weakness, in a swing market decline, buyers were stronger than sellers at the low, when the low happens to be where “A” and “C were. In a metaphysical-like editorial comment, when it comes to developing market activity, there are no accidents.
There is more to what happened once low “E” was established. Compare the length of time, [remember those three factors, price, volume, and time, mentioned in the first paragraph?], passed between rally “C to D” and the decline from “D to E.” The rally developed in 8 weeks, but it took 13 weeks to retrace the gain. The market is telling us that sellers are laboring more than buyers. Plus, the bar ranges in the decline tend to be smaller. Smaller ranges down tell us that sellers were having more of a difficult time. Buyer from the previous rally had an easier rally up. There is a logical conclusion one can infer from those observable facts.
After the low at “E,” price moves sideways for another 13 weeks, [added to the 13 week decline from "D," there have been no new lows under "C" for 26 weeks!...an aside]. This sideways movement is a balance between buyers and sellers. From balance, we can expect imbalance. Enter the rally to “F.”
We noted where the rally began from congestion, and that is where the imbalance came in. You can see how the ranges were larger on this rally, compared to the ranges in the decline to “E,” and all the closes were on the high end, telling us buyers were in control. That control weakened, evidenced by the lack of upside progress for four weeks. Given our
overall bullish bias toward gold, we viewed those four weeks as closes clustering that could be a resting spell, or lead to a turning point. It led to a turning point, but we are not willing to be sellers in precious metals, based upon the primary trend being up, and bullish implications as we have been outlining.
When demand fails to show up, near the high at “F,” it opens the door for sellers to take advantage and push price lower, for some period of time. After the close, two weeks ago, we wrote our commentary, “Stop Putting The Cart Before The Horse,” [click on http://bit.ly/SqIzD6], as a message to not expect $2,000, $5,000, or even $10,000 gold, as has been bandied about by so many, because the charts were not indicating price was going to higher levels, at that point. It certainly looked like sellers were embarking upon a small rout that could take price back to the low of the trading range. One thing we know for certain: No one can know the future; it has not yet happened. Trite, but true, and oft ignored.
What happened was that the decline, on sharply higher volume, on a wide range bar down with a poor close, stopped dead! In hindsight, it appears it was a mini-selling climax. The ranges of the bars prior to that day were relatively small, showing little to no selling pressure, so the sudden decline that day came as a surprise. Immediately following the decline, we see an outside key reversal, OKR, a lower low followed by a higher high, and here, a higher close, right near the top of the bar.
This is a great example of how flexibility is required in making market assessments. Up to that sudden sell-off day, it looked negative for what was to follow. What did follow was an equally surprising reversal. We must be able to accept new developing market information from one hour/day/week to the next and adjust accordingly.
One more observation, but they ALL tell an important story if you have an interest in what may happen for gold, moving forward. The decline that abruptly ended stopped above the half-way mark of the range between the swing high and swing low, “E to F.” In general, when a correction holds above a 50% retracement, it tells us that price is relatively strong, especially in what appeared after potential weakness, and in a protracted trading range.
When you take the simple observation given from the monthly chart, that the correction within that higher time frame has been relatively weak…[let us add here that weak corrections lead to higher prices, another market message]…the context of the myriad clues teeming in the weekly chart, all factually based from the market itself, one can draw a quite positive outlook without considering external opinions. The market is never wrong; opinions usually are.
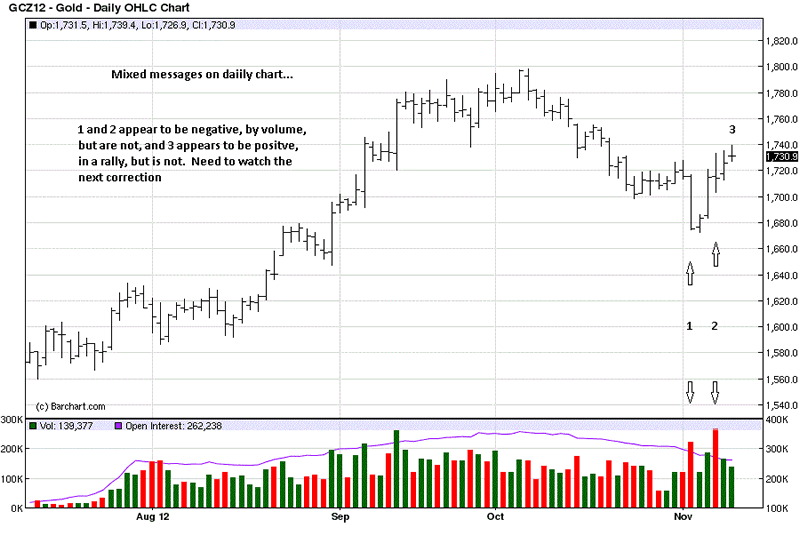
After what seems like stellar messages from the weekly chart, the daily appears to be more of a mixed message, but it is a lower level time frame. Higher level time frames hold greater weight. There are three aspects on the daily chart to which we will confine our comments. Red volume bars denote that day’s volume occurred on a lower close, generally, an indication of sellers.
You see the highest selling volume, up to the point, at “1,” from a week ago Friday when it seemed like a retest lower was imminent. Price turned around, instead, and we will not go into detail about the next day’s bar which said price may hold, as it did. The highest day of selling volume is shown at point “2.” Ostensibly, both are negative in implication. We were delighted to see the volume, range, and close at “2.”
Wouldn’t you expect to see price decline as a result of so much volume effort at “2?” Yet, compare the close, relative to the previous day’s close…practically unchanged. With so much energy expended by sellers, where was the payoff? There was none! What another big message from the market. It is telling us that buyers continue to show up at critical points in developing market activity. The market even made a higher low from the prior day. What seems negative turned out to be positive.
We did say the daily chart message was mixed. While the week ended on a rally note, the last “note” of the week was a small range day, a lack of demand, and the close was not very strong. This apparent lack of demand can lead to some selling, but we cannot know for certain. We will let the market tell us. It certainly tells us some pretty impressive information, when we look for it, and it is always there, in plain sight for everyone to see.
Does this stuff work? Absolutely. It is not always so easy, at times, but patience in using
market information can, and does pay off. We went long gold at 1659, on 29 August, when price broke out of its trading range. See the weekly chart, same bar as “Rally from congestion.” On the daily chart, the buy date was the day two before the strong rally bar at the end of August. You can call that last day of August a VDB, Vertical Demand Bar, and we were of the belief then, and still are, that price would hold above it. We still hold that core position.
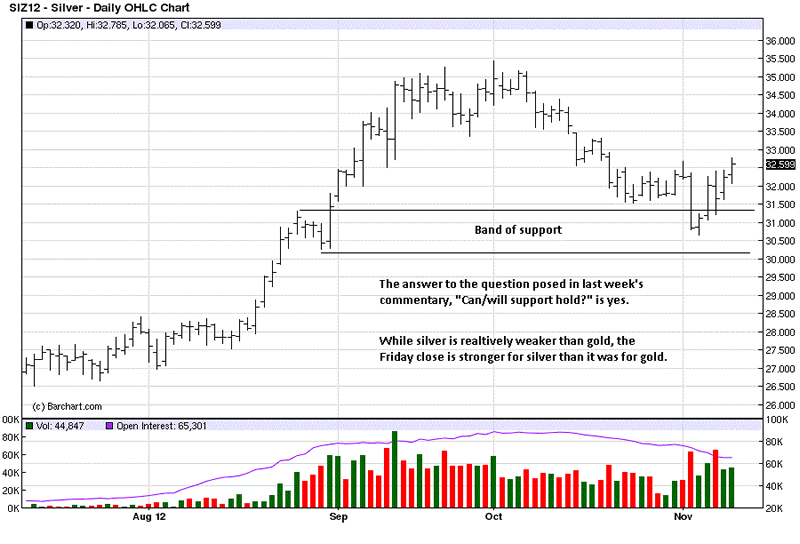
After such a lengthy gold analysis, silver will suffer in coverage. Most of the commentary from last week still applies, seen on monthly and weekly charts, [click here, 4th and 5th charts, http://bit.ly/SqIzD6]. When we posed the question of potential support holding, last week on the daily, the last 5 bars had not yet printed. Five bars later, that band of support has proven valid. As a similar follow-up in gold, we went long a core position for silver at 30.60 on its breakout, back on 24 August. The entry was cleaner than gold was then, which is why the long gold position was later in time.
We have recommended the purchase of physical gold and silver for months on end, to be held personally, and NOT in any institution where it can be stolen. Think MFGlobal, for one. While the timing of trading in futures may be of interest, fewer and fewer traders are participating, due to margin issues, loss of faith in anything paper-denominated, etc. Think of the poor holders of “allocated” gold, held by banks, including the vaunted Swiss, when comes the time the [now much less] wealthy gold holders try to stake their claim, only to discover a paper stake driven through their [overly re-hypothecated and now likely gone] assets.
We will now watch for a retest of the current rally that may allow for an edge in taking a long position in the futures. In the interim, keep buying the physical, for once people open their eyes and follow the yellow brick road, the Wizards [central bankers] will be exposed for the re-re-hypothecation scam they created.
By Michael Noonan
Michael Noonan, mn@edgetraderplus.com, is a Chicago-based trader with over 30 years in the business. His sole approach to analysis is derived from developing market pattern behavior, found in the form of Price, Volume, and Time, and it is generated from the best source possible, the market itself.
© 2012 Copyright Michael Noonan - All Rights Reserved Disclaimer: The above is a matter of opinion provided for general information purposes only and is not intended as investment advice. Information and analysis above are derived from sources and utilising methods believed to be reliable, but we cannot accept responsibility for any losses you may incur as a result of this analysis. Individuals should consult with their personal financial advisors.
© 2005-2022 http://www.MarketOracle.co.uk - The Market Oracle is a FREE Daily Financial Markets Analysis & Forecasting online publication.