


U.S. Stock Market Indices Bottom Is Near! MAP Wave Analysis
Stock-Markets / Stock Markets 2012 Nov 19, 2012 - 02:12 AM GMTBy: Marc_Horn

 It looks very much that the US indices are aligned for slow sideways movement before making this MAP Wave scale lows before the end of the year! I imagine that may well have something to do with the US budget fiasco of which the result will be what Europe has achieved over recent years – to kick the can down the road which should bring some relief, and will cause MAP Wave daily pivot scale retest of the recent highs!
If that retest fails then anyone that still believes we are in a bull market really should question their models as so far all indexes have failed to make all time highs, with the Russell coming closest, but still failing.
The DOW and Russell have broken their monthly support and the SPX has bounced on its monthly support. The Nasdaq bounced on its Q ML and is the only Index projected not to break its 2009 low.
One really need to ask oneself how is this possible with the masses of money that has been printed – I mean after all this wonderful Keynesian economic model our governments in the West so faithfully follow just does not seem to be working! The reason is very simple, combined with the reduction in the velocity of money, money is leaving the economy faster than it is being printed! This is called capital flows.
A very good example is the effective killing of the gold trade in France where it no longer can be bought for cash – does the government really think people are that stupid? Now the French just drive over to Belgium and buy their gold where business is booming! Think on a bigger scale – the British increased taxes and receipts drop! The French being very objective do the same! The result is that people move out of the country with their capital! Is it not time to update our economic thinking?
MAP Wave Analysis, unlike Elliot Wave and Andrews Pitchforks, is a systematic methodical rule based approach, details of which can be found either on my blog or here on The Market Oracle and data is archived and updated in a format that is traceable. This allows easy evaluation of MAP Wave Analysis effectiveness when making investment decisions, as well as traceability to improve the methodology.
For the full reports to compare projections with price movement click on the indexes below. To ensure the latest updates please click follow on my blog, as you will see on the S&P update below – things can change quickly! This is because the pivot target gets fine tuned as smaller wave fractals develop!
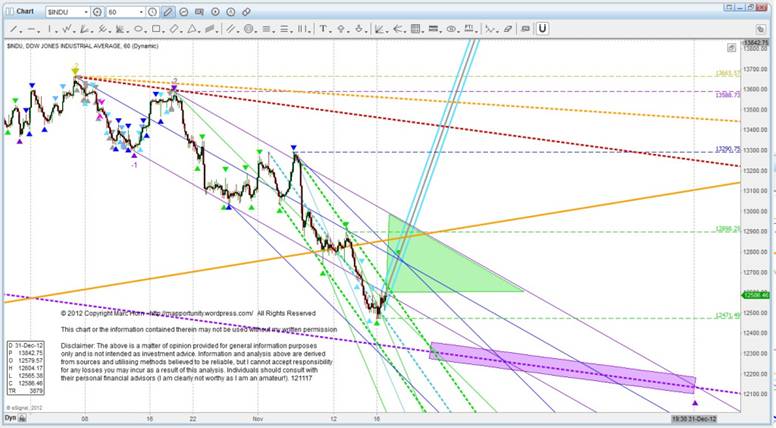
DOW
Nicely followed the channel of the 19 October update, making pivots on the lower and then upper rail. Then more energy was needed to break the remaining M234MLL (lower orange bold up sloping line) where it made H-1 and H-2 and then nicely followed the H channel which it will break to put in H-4 in the green triangle. This will be followed by a low as late as the end of December in the region of 12100 to 12200 depending on where it hits the purple rectangle shown.
S&P
If you read my previous article MAP Wave Analysis - Stock Market Clues of US Fiscal Cliff? and receive my regular updates you will have seen this following the morning action!
SPX - Upwave over for today! 12 Nov 2012
Based on today’s action H-3 is actually 10-1 as detailed below which will be confirmed with a break of Fridays low.
THIS MEANS HIGH MOMENTUM AS A WAVE CAN BE THE SAME FREQUENCY AS A BIGGER SCALE.
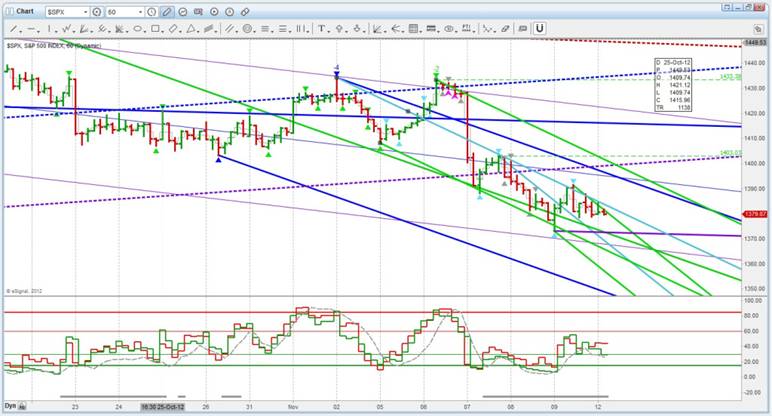
Expect D-1 on Lower 4 H MLL
This upwave is over!!
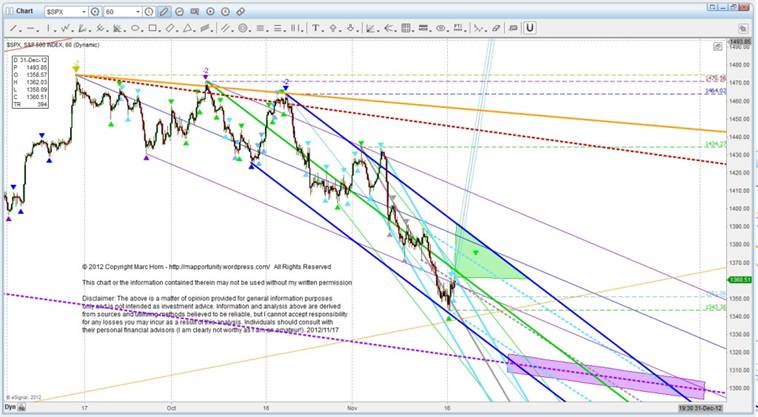
UPDATE 17 November 2012
As projected on the 12th blog update pasted above, H-3 has been made on the lower 4H0-1-2MLL.
One more H wave down (expected in the green triangle) after this correction is complete in the purple rectangle region around 1300 as early as the beginning of December, but should be in by the end of the year. Once pivot H-4 is in we should have a better idea as to when, but I suspect, like many other indices the fiscal cliff will be averted by kicking the can down the road European style to make D-2 when disillusionment will set in for wave D-3 to test the 2009 lows, most likely just above as the can gets kicked down the road again!
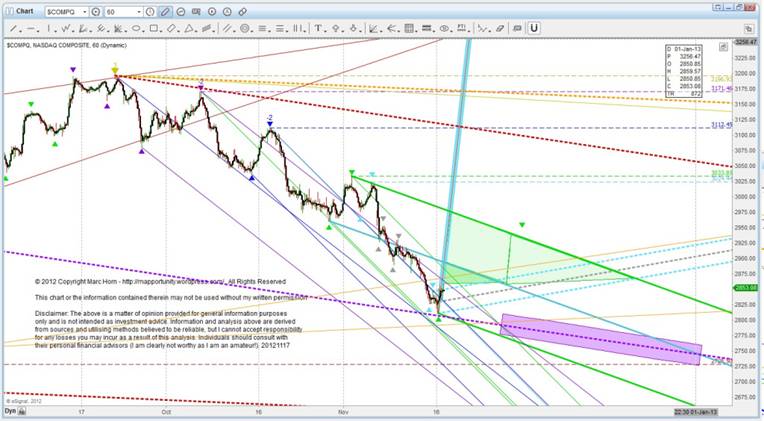
Nasdaq
Forgot to show projection!!!! But concentrated on projected top! Anyway below you can see that it bounced out of its channel, only to return. That action has led to the below projection with a low between 2700 and 2800 before the end of December. There is going to be a lot of sideways movement on this one once it has completed H-4.
Russell
I have not posted on the Russell for a while so here is my most current assessment for the Russell
The Russell by failing to break its all time high has showed it hand that it too is in a major bear market with all the rest! I have been thinking about this a lot, and fractal waves have the answer – everything has its own time! But why would the Russell show it hand so late? I suspect as I have not looked at the composition that this index actually reflect the smaller manufacturing type of business – the type that actually generates wealth in contrast to the DJIA with the old megaliths that have lost touch with reality and need to outsource innovation and survive through sheer size – but even Goliath was overcome by David, and the S&P which has banks and service industries in it that only push wealth around as opposed to actually adding value and generating wealth. Pure speculation on my part at the moment but, I will look at it in the near future!
Big Picture
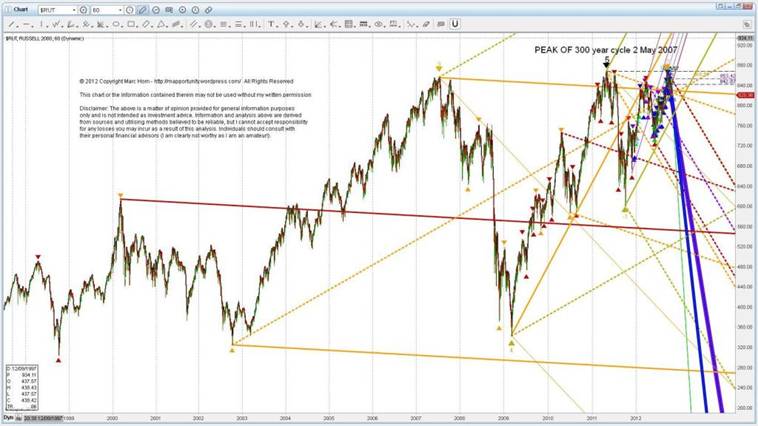
And the retest failure confirming the bear is with us!
I am sure you can guess where it is going!
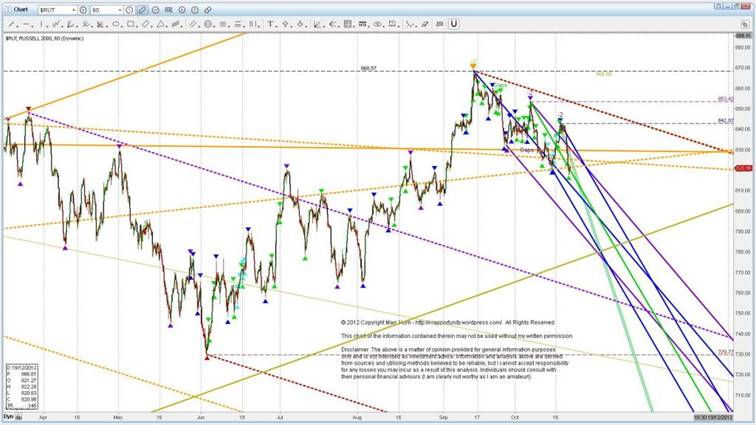
UPDATE 20121117
Side note – The Russell has bounced hard off the ML shown above causing it to exceed its upper trend channel. However if you understand fractal waves then you would know this is not a problem as this type of price action is to be expected with the confluence of lines of overlapping fractal waves, and as expected it has rejoined its projected channel as you can see below!

This bounce will complete H-4 and D-1 is projected to be in by the 24th December in between 740 and 750 a week earlier than the S&P and Dow which are projecting late bottom dates of 31 December! So it may well be worth watching the Russell for completed wave formation as a leading indicator! It is extremely negative for the outlook of the Russell that it has so easily broken support of the Q45-1 MLL its last remaining long term support.
Click here to follow your duty of Use and copyright is described therein.:
Probabilities are derived from the MAP Analysis methodology described therein,
Click follow on my blog to receive regular FREE market updates and discussion.
For other articles published click here
For more information of how I do what I do http://mapportunity.wordpress.com/ . Comments and discussions very welcome!
The statements, opinions and analyses presented in this site are provided as educational and general information only. Opinions, estimates, buy and sell signals, and probabilities expressed herein constitute the judgment of the author as of the date indicated and are subject to change without notice.
Nothing contained in this site is intended to be, nor shall it be construed as, investment advice, nor is it to be relied upon in making any investment or other decision.
Prior to making any investment decision, you are advised to consult with your broker, investment advisor or other appropriate tax or financial professional to determine the suitability of any investment.
© 2012 Copyright Marc Horn - All Rights Reserved Disclaimer: The above is a matter of opinion provided for general information purposes only and is not intended as investment advice. Information and analysis above are derived from sources and utilising methods believed to be reliable, but we cannot accept responsibility for any losses you may incur as a result of this analysis. Individuals should consult with their personal financial advisors.
© 2005-2022 http://www.MarketOracle.co.uk - The Market Oracle is a FREE Daily Financial Markets Analysis & Forecasting online publication.