


Ireland and Iceland : A Tale of Two PIIIGS
Economics / Economic Theory Nov 22, 2012 - 10:20 AM GMTBy: Frank_Shostak

 There were a lot of commentaries regarding the Ireland and Iceland 2008–2012 financial crises. Most of the commentaries were confined to the description of the events without addressing the essential causes of the crises. We suggest that providing a detailed description of events cannot be a substitute for economic analysis, which should be based on the essential causes behind a crisis.
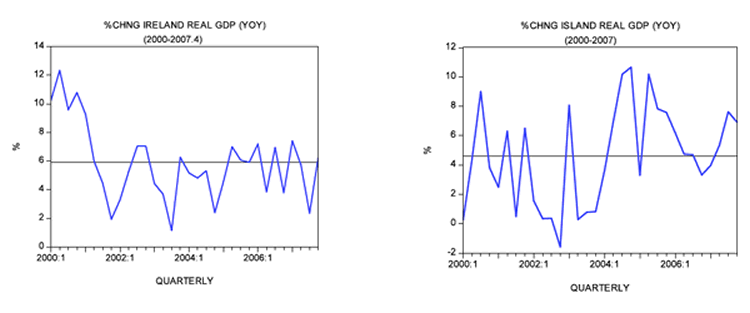
The essential cause is the primary driving force that gives rise to various events such as reckless bank lending (blamed by most commentators as the key cause behind the crisis) and a so-called overheated economy. Now, in terms of real GDP, both Ireland and Iceland displayed strong performance prior to the onset of the crisis in 2008. During 2000–2007, the average growth in Ireland stood at 5.9 percent versus 4.6 percent in Iceland. So what triggered the sudden collapse of these economies?
Central-Bank Policy the Key Trigger for Economic Boom
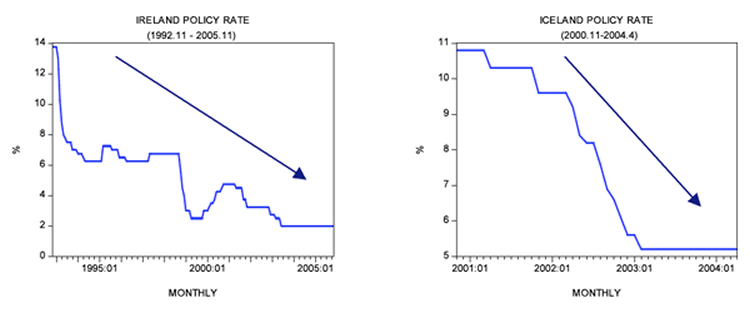
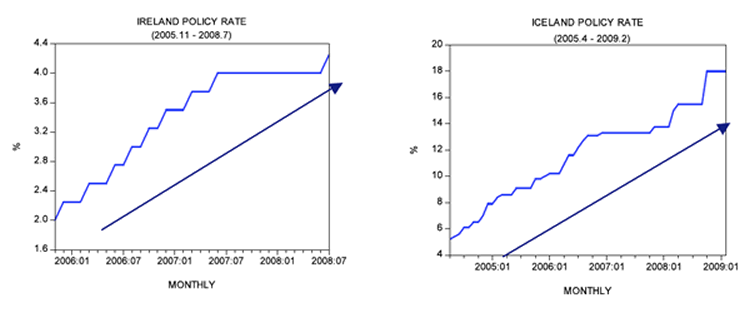
What set in motion the economic boom (i.e., a strong real GDP rate of growth) in both Ireland and Iceland was an aggressive lowering of interest rates by the respective central banks of Ireland and Iceland. In Ireland, the policy rate was lowered from 13.75 percent in November 1992 to 2 percent by November 2005. In Iceland, the policy rate was lowered from 10.8 percent in November 2000 to 5.2 percent by April 2004.
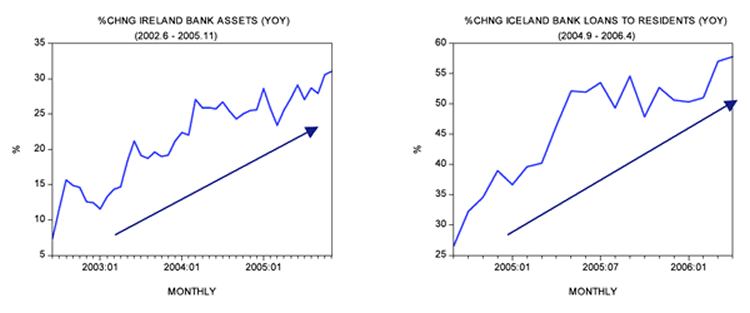
In response to this, bank lending showed a visible strengthening with the yearly rate of growth of Irish bank assets rising from 7.4 percent in June 2002 to 31 percent by November 2005. In Iceland, the yearly rate of growth of bank lending to residents climbed from 26.5 percent in September 2004 to 57.8 percent by April 2006.
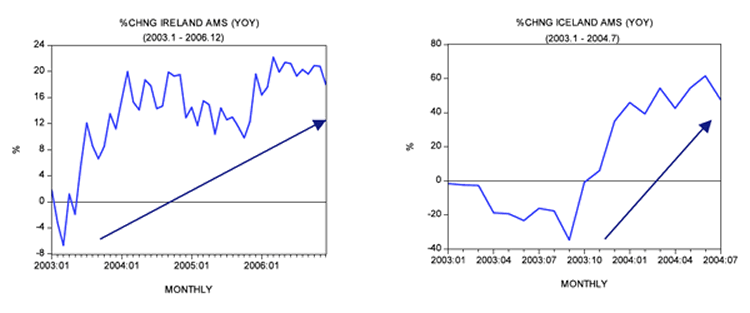
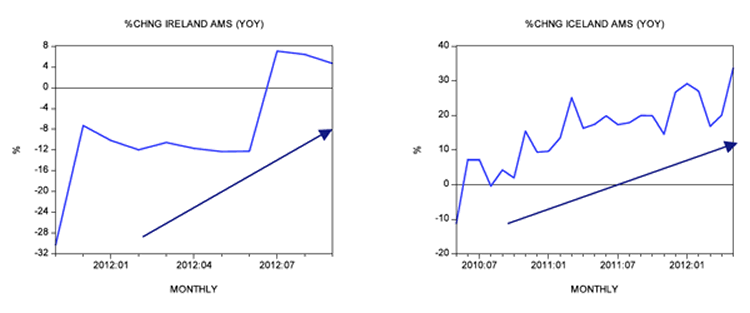
The growth momentum of the money supply strengthened visibly in both Ireland and Iceland. The yearly rate of growth of our measure of money supply (AMS) for Ireland jumped from minus 6.7 percent in March 2003 to 22 percent by March 2006. In Iceland, the yearly rate of growth of AMS climbed from minus 1.6 percent in January 2003 to 61.6 percent by June 2004 before closing at 47.7 percent by July 2004.
The aggressive lowering of interest rates, coupled with strong increases in the money-supply rate of growth, gave rise to various bubble activities. (The central banks' loose monetary stance set in motion the transfer of wealth from wealth-generating activities to nonproductive bubble activities.)
Central-Bank Policies Trigger Economic Bust
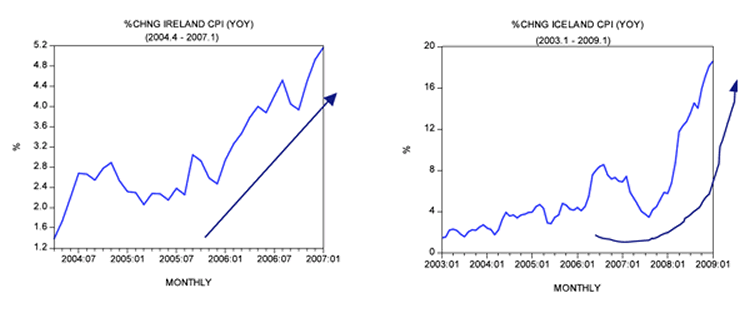
Because of strong increases in the money-supply rate of growth, a visible strengthening in price inflation took place in Ireland and Iceland. In Ireland, the yearly rate of growth of the consumer price index (CPI) rose from 2.9 percent in January 2006 to 5.1 percent by March 2007. In Iceland, the yearly rate of growth of the CPI jumped from 1.4 percent in January 2003 to 18.6 percent by January 2009.
To counter the acceleration in price inflation, the central banks of Ireland and Iceland subsequently tightened their stance. The policy interest rate in Ireland rose from 2.25 percent in January 2006 to 4.25 percent by July 2008. In Iceland, the rate shot up from 10.2 percent in January 2006 to 18 percent by February 2009. Furthermore, the pace of money pumping by the central bank of Ireland fell to minus 8.2 percent by July 2007 from 25 percent in January 2007. The pace of pumping by the Iceland's central bank fell to 43 percent by February 2008 from 123 percent in July 2006.
The yearly rate of growth of AMS in Ireland plunged from 32 percent in August 2009 to minus 30 percent by November 2011. In Iceland, the yearly rate of growth of AMS fell from 96 percent in October 2007 to minus 18 percent by September 2009.
The sharp fall in the growth momentum of the money supply, coupled with a tighter interest-rate stance, put pressure on various bubble activities that emerged on the back of the previous loose-monetary-policy stance.
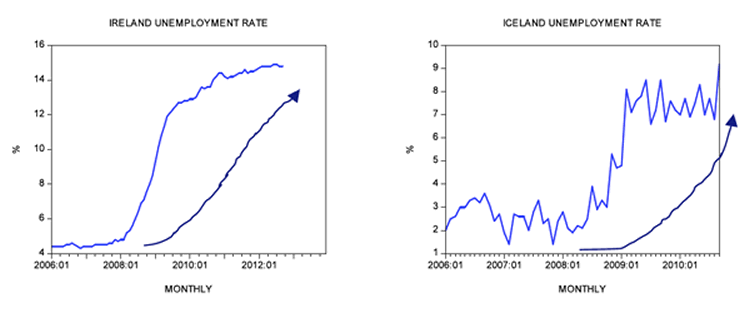
Consequently, various key economic indicators came under pressure. For instance, the unemployment rate in Ireland rose from 4.4 percent in January 2006 to 14.9 percent by July 2012. In Iceland, the unemployment rate climbed from 2 percent in January 2006 to 9.2 percent by September 2010. Year on year, the rate of growth of Irish real retail sales fell from 3.8 percent in January 2008 to minus 25 percent by September 2009. In Iceland, the yearly rate of growth of real retail sales fell from 11.9 percent in Q1 2008 to minus 31 percent by Q1 2009.
Most commentators blame the crisis on the conduct of banks that allowed the massive expansion of credit. It is held that this was responsible for the massive property boom in Ireland and overheated economic activity in Iceland.
We hold that the key factor in the economic crisis was the boom-bust policies of the central banks of Ireland and Iceland. Loose monetary policy had significantly weakened the economies' abilities in both Ireland and Iceland to generate wealth. This resulted in the weakening of various marginal activities. Consequently, a fall in these activities, followed by a decline in the pace of lending by banks — and this, in turn, coupled with a tighter stance by central banks — set in motion an economic bust. With the emergence of a recession, banks' bad assets started to pile up and this in turn posed a threat to their solvency.
From May 2007, the banks' stock prices on the Irish stock market declined markedly — they had halved by May 2008. This had an inevitable effect on banks' capital-adequacy ratios and therefore their ability to lend the ever-higher amounts that were necessary to support property prices.
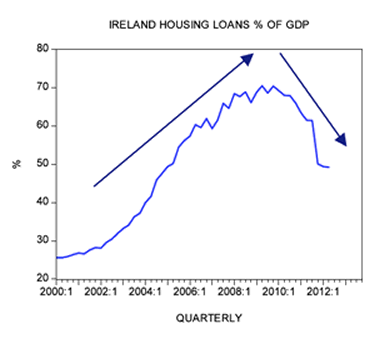
As a result, housing loans as percentage of GDP plunged from 70.5 percent in Q2 2009 to 49.2 percent by Q2 this year. At the height of the boom, a fifth of Irish workers were in the construction industry. The average price of a house in Ireland in 1997 was €102,491. In Q1 2007 the price stood at €350,242 — an increase of 242 percent. The average price of a home in Dublin had increased 500 percent from 1994 to 2006.
Now, in Iceland, at the end of Q2 2008, external debt was €50 billion, more than 80 percent of which was held by the banking sector — this value compares with Iceland's 2007 GDP of €8.5 billion. The liabilities of the three main banks were almost 10 times the size of the island's GDP.
With the emergence of the bust, Icelandic authorities allowed its banks to go belly up, while the Irish government decided to support the banks. According to estimates, the cost to the taxpayers of providing support to Irish banks stood at €63 billion. (The private debt of the failed banks was nationalized.) In Iceland, the government, by allowing Icelandic banks to fail, made foreign creditors, not Icelandic taxpayers, largely responsible for covering losses.
The fact that Iceland allowed the banks to go bankrupt was a positive step in healing the economy. Unfortunately Iceland introduced a program of safeguarding the welfare of the unemployed. Also, the collapse of the Icelandic krona was a hard hit to homeowners who borrowed in foreign currency. In response to this, the authorities orchestrated mortgage-relief schemes. Iceland has also imposed draconian capital controls. Obviously, all this curtailed the benefits of allowing the banks to go belly up.
Whether the Icelandic economy will show a healthy revival, as suggested by some experts, hinges on the monetary policy of Iceland's central bank. We suggest the same applies to Ireland. (What is required is to seal off all the loopholes for the growth of the money supply.)
However, it is clear that Iceland's economic situation is less bad than Ireland's, and that is largely due to the Iceland's allowing its banks to go bankrupt.
Bad Policies Are Coming Back
For the time being in Iceland, the yearly rate of growth of AMS jumped from minus 11.3 percent in May 2010 to 34 percent by May 2012. Also, in Ireland, the growth momentum of AMS is showing strengthening with the yearly rate of growth rising from minus 30.3 percent in November last year to 4.7 percent in September 2012.
The rising growth momentum of money supply is a major threat to sound economic recovery in both Ireland and Iceland.
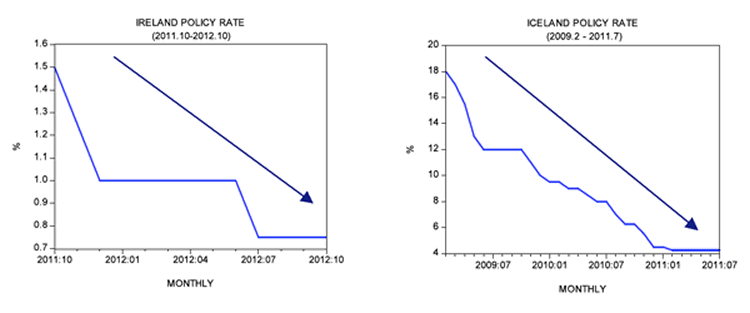
Also note that the policy interest rate in Ireland fell from 1.5 percent in October 2011 to 0.75 percent at present. In Iceland, the policy rate was lowered from 18 percent in February 2009 to 4.25 percent by July 2011. All this again sets in motion a misallocation of resources and new bubble activities — and, in turn, economic impoverishment.
Summary and Conclusion
Many commentators blame reckless bank lending as the key cause behind the 2008–2012 financial crises in Ireland and Iceland. Our analysis, however, suggests that it was not the banks as such that caused the crisis but rather the boom-bust policies of the central banks of Ireland and Iceland. It is these institutions that set in motion the false economic boom and the consequent economic bust. While Iceland allowed its banks to go bankrupt, the Irish government chose to bail out its banks. So, in this sense, the Icelandic authorities did the right thing, and Iceland has consequently outperformed Ireland economically. We hold that despite this positive step, Iceland's authorities have introduced various welfare schemes that have curtailed the benefits of having let banks go belly up. Furthermore, both Ireland and Iceland have resumed aggressive money pumping, thereby setting in motion the menace of boom-bust cycles.
Frank Shostak is an adjunct scholar of the Mises Institute and a frequent contributor to Mises.org. He is chief economist of M.F. Global. Send him mail. See Frank Shostak's article archives. Comment on the blog.![]()
© 2012 Copyright Frank Shostak - All Rights Reserved Disclaimer: The above is a matter of opinion provided for general information purposes only and is not intended as investment advice. Information and analysis above are derived from sources and utilising methods believed to be reliable, but we cannot accept responsibility for any losses you may incur as a result of this analysis. Individuals should consult with their personal financial advisors.
© 2005-2022 http://www.MarketOracle.co.uk - The Market Oracle is a FREE Daily Financial Markets Analysis & Forecasting online publication.