


How to Trade Using the Inside Bar Strategy Candlestick Chart Pattern
InvestorEducation / Learn to Trade Nov 28, 2012 - 03:39 AM GMTBy: Submissions

 Steve Jones writes: The inside bar strategy is a binary options strategy that is based on the momentum strategy. If you want to use it we recommend you first read about the Momentum Strategy and then read this article about the Inside Bar Strategy to fully understand how it works.
The Inside Bar Strategy is easy to understand and easy to use. After you understand the momentum of your asset you can use either the Momentum or the Inside Bar strategies, or even mix them together for better results.
What is The Inside Bar Strategy?
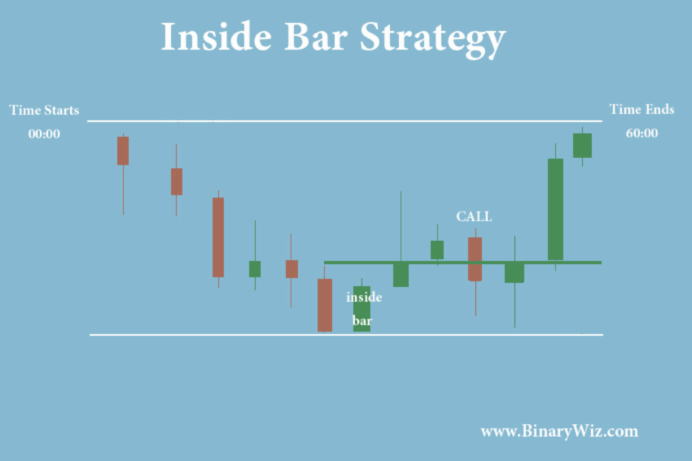
An inside bar is a bar on the candlestick chart that is found inside a range of previous price actions (bars) on a single asset. On a smaller time frame this will look like a triangle and would be easy to recognize quickly. If you look closely on the graph you could see an upside down triangle that will help you spot the inside bar more clearly. The strategy is helpful in recognizing tops and bottoms of the asset, and also a down or up trend.
Once you have indicated an up or down trend and identified an inside bar, you should draw a horizontal line on the main candle to the direction that the inside bar is suggesting. If the trend is downwards (Like in the graph below) you should draw a line at the top of the candlewick. When another candle from inside the range has closed above the line you should enter on the next candle with a call option, or wait for a pull back. In case the trend is going upwards, you should do exactly the opposite (with a graph showing a bottom based triangle).
So Where’s the Catch?
Spotting the inside bar just by looking at it and trying to find a triangle can be hard sometimes. In some occasions you would spot it only after the asset had already went up or down, and it wont be relevant anymore. Another downside of the Inside Bar Strategy is that it is based on the Momentum Strategy. The Momentum Strategy is a strategy that helps you figure out what the asset momentum is, so you could either purchase a Call or a Put option and “Buy” or “Sell” the asset with that information.
The main problem with using the Momentum Strategy is that you need to use a professional indicator in order to get good results. If you are an amateur it probably wouldn’t be profitable for you to pay for a professional indicator and therefore it is not recommended that you use this strategy. The only thing an amateur can do in order to use this strategy properly is to read a lot of market analyses and also analyses for the asset you chose and this way acquire a better understanding of where the “wind is blowing”.
It is important to remember that even professional analysts go wrong sometimes (and many times) with their analyses since sometimes there are external factors that influence and other times they are just simply wrong. You should keep that in mind when you read professional advice and analysis and try to make a calculated decision.
Steve Jones, Chief Editor at www.BinaryWiz.com. Steve Jones has vast experience in futures trading. His main expertise is compound commodity and currency options trading.
© 2012 Copyright Consumer Metrics Institute - All Rights Reserved Disclaimer: The above is a matter of opinion provided for general information purposes only and is not intended as investment advice. Information and analysis above are derived from sources and utilising methods believed to be reliable, but we cannot accept responsibility for any losses you may incur as a result of this analysis. Individuals should consult with their personal financial advisors.
© 2005-2022 http://www.MarketOracle.co.uk - The Market Oracle is a FREE Daily Financial Markets Analysis & Forecasting online publication.