


The Fed’s Most Ominous Economic Indicator!
Economics / US Economy Nov 28, 2012 - 12:46 PM GMTBy: Sy_Harding

 Fed Chairman Bernanke has been pounding the table publicly and privately, stressing how important it is that Congress reach an agreement preventing the economy from going over the fiscal cliff at year-end. You’ve seen the numbers estimating the impact on the already anemic economy.
But here’s the chart that’s keeping Bernanke awake at night, the Fed’s own Chicago Fed National Activity Index (CFNAI).
This is no simplistic indicator thrown together by an analyst trying to promote his opinion through data-mining for data to support his pre-conceived notions.
The CFNAI is an index comprised of 85 established economic indicators and trends drawn from all areas of the economy. It was first compiled in 1967 and has a remarkable record for identifying early on when the economy has entered a recession.
The numbers are reported monthly. A positive level for the index indicates the economy is growing, while a negative number indicates the economy is slowing.
The index has been of concern for a while. The monthly reading of the index was in negative territory for five consecutive months before improving to the flat-line at 0.0 in September.
Unfortunately, that improvement lasted only one month. The report this week shows a sizable drop to -0.56 in October.
More ominously, its more important 3-month moving average also dropped to -0.56 in October from -0.36 in September. It was its 8th straight month of negative readings, and getting ominously close to the -0.70 level the Fed considers “an increasing likelihood that a recession has begun.” It is the solid line in the Fed’s chart.
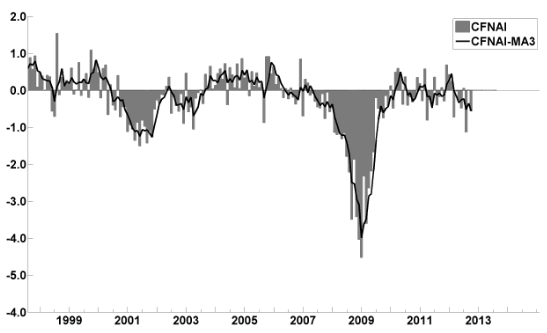
The index has only dropped beneath the recession warning level of -0.7 eight times since 1967. That was in 1970, 1974, 1980, 1981, 1989, 1990, 2001, and 2008. Each time the economy was indeed in a serious slowdown, usually a recession, and seven of those eight times the stock market was already in a bear market or soon rolled over into one. The most recent occasions were in 2001 and 2008, certainly not pleasant memories for the country.
The financial media and investors don’t pay much attention to the CFNAI, and most of the time it is not of much importance.
But with the 3-month moving average in negative territory for 8 straight months, and now at -0.56, so perilously close to -0.70, it should have everyone’s attention.
That goes double for politicians in Washington, their own positions and financial health assured, squabbling over how much to care about the fiscal cliff and the rest of the country.
Sy Harding is president of Asset Management Research Corp., and editor of the free market blog Street Smart Post.
© 2012 Copyright Sy Harding- All Rights Reserved
Disclaimer: The above is a matter of opinion provided for general information purposes only and is not intended as investment advice. Information and analysis above are derived from sources and utilising methods believed to be reliable, but we cannot accept responsibility for any losses you may incur as a result of this analysis. Individuals should consult with their personal financial advisors.
Sy Harding Archive |
© 2005-2022 http://www.MarketOracle.co.uk - The Market Oracle is a FREE Daily Financial Markets Analysis & Forecasting online publication.