


Stock Market SP500 at a CRUCIAL Pivot Point
Stock-Markets / Stock Markets 2012 Dec 03, 2012 - 11:10 AM GMTBy: David_Banister

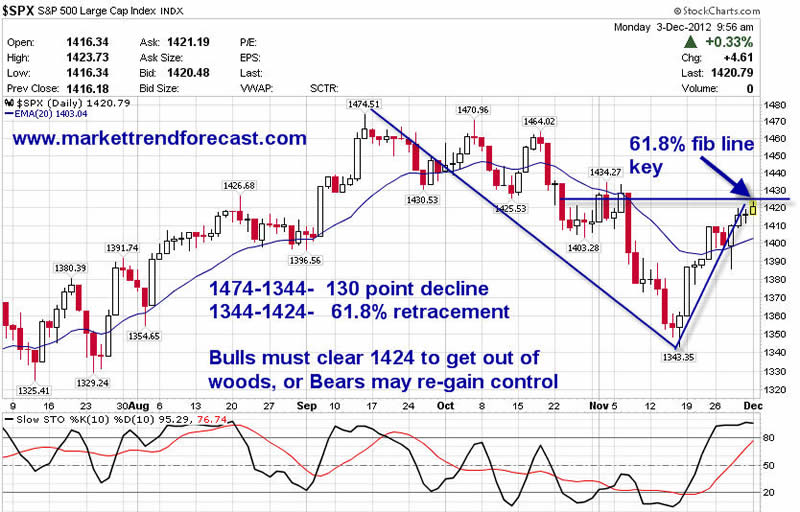
We had an interesting 131 point SP 500 decline from the summer-fall highs of 1474 to the recent 1344 lows. Interesting because in the work that I do, we focus on crowd behavioral patterns, sentiment, and Elliott Wave Theory. There is no one technical analysis methodology that works all the time, so it’s important to incorporate other elements into your work to help with some clues. Let’s examine the crossroad we are at right now around 1420 on the SP 500 and why the next move may be a “tell” as they say in poker.
The correction from the 1474 highs can be read as a 3 wave correction, which in Elliott Wave Theory is corrective against the major trend, which so far has been up. 3 wave corrections serve to work off over zealousness of the crowd and above average bullish sentiment. To be sure, at the 1474 highs the sentiment surveys were running pretty hot and near 3 year highs, a flag that waved a warning sign for us. The correction though worked off that sentiment and at 1344 was in fact a Fibonacci 61.8% retracement of the rally from 1257-1474 that we witnessed this summer. These type of Fibonacci fractal retracements at 61.8% are common correction patterns in bull cycles.
What we need to see near term on this crossroad then is a clear cut rally over the 1424 area, which now is a 61.8% upwards retracement of the drop from 1474-1344. Why is that important to clear? Because 61.8% also is a common upwards retracement for a wave 2 counter-rally in a downward trend. Clearing that hurdle would indicate that the rally from the 1344 lows is more than just a counter-trend rally, and likely the confirmed start of a solid leg upwards towards highs for this bull market cycle.
This is why we like to draw these lines in the sands and let our subscribers be aware of what to watch and why. See the chart below to get an idea of where we are at in the current cycle: Consider joining us so we can help you with daily updates on the SP 500 and Gold, stop scratching your head and guessing as to the patterns in the markets today! 33% discount if you go to www.MarketTrendForecast.com and sign up, and or sign up for our free weekly reports.
CIO-Founder
Active Trading Partners, LLC
www.ActiveTradingPartners.com
TheMarketTrendForecast.com
Dave Banister is the Chief Investment Strategist and commentator for ActiveTradingPartners.com. David has written numerous market forecast articles on various sites (MarketOracle.co.uk, 321Gold.com, Gold-Eagle.com, TheStreet.Com etc. ) that have proven to be extremely accurate at major junctures.
© 2012 Copyright Dave Banister- All Rights Reserved
Disclaimer: The above is a matter of opinion provided for general information purposes only and is not intended as investment advice. Information and analysis above are derived from sources and utilising methods believed to be reliable, but we cannot accept responsibility for any losses you may incur as a result of this analysis. Individuals should consult with their personal financial advisors.
© 2005-2022 http://www.MarketOracle.co.uk - The Market Oracle is a FREE Daily Financial Markets Analysis & Forecasting online publication.