The Significant Impact of U.S. Crude Oil Production
Commodities / Crude Oil Dec 03, 2012 - 12:35 PM GMTBy: Frank_Holmes
 The Eagle Ford shale formation lies south of our headquarters in San Antonio, Texas, giving the U.S. Global investment team a firsthand, tacit perspective on the oil and gas industry's growing natural resources phenomenon. We've witnessed how the oil activity is boosting the local economy with solid-paying jobs, a healthy housing market and strong consumer sentiment, as oil giants such as Schlumberger and Halliburton take a bigger stake in the area.
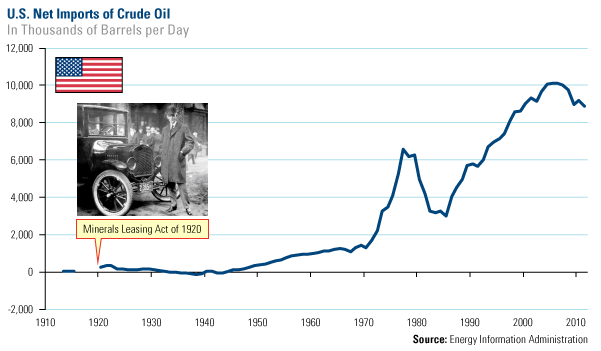
After seven long decades of importing oil, the U.S. seems only a few years away from reversing the flow, largely from shale technology not only in Texas but several areas around the country. In 2005, the U.S. reported net imports of 13.5 million barrels per day, or almost two-thirds of its oil needs, according to Raymond James. By the end of 2012, net imports are projected to fall to 8.6 million barrels per day, which is about half of the country's current consumption.
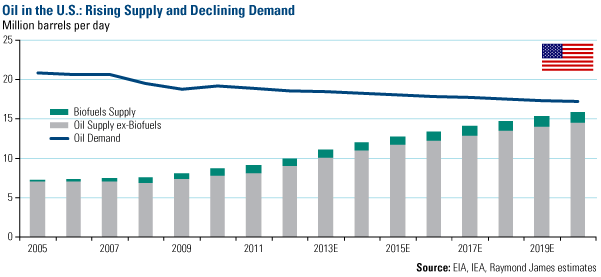
By 2020, the estimated gap between supply and demand narrows considerably.

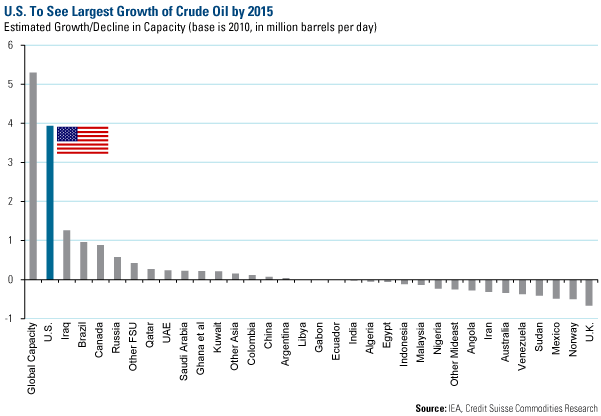
Production has been growing at such a steady pace in recent years that Credit Suisse says the U.S. should see the largest growth of crude oil than any other oil producing country by 2015. An anticipated growth capacity of nearly 4 million barrels per day in the U.S. is three times more than Iraq, and almost four times more than Brazil, Canada and Russia.

2012 might be the year that the world fully realizes the significant contribution North America has made to the overall global oil supply, especially after the International Energy Agency (IEA) claimed that the U.S. would surpass Saudi Arabia as the largest oil producer around 2020.
The U.S. output expected by 2020 amounts to more than 10 percent of what the IEA says will be the world's daily oil requirement of 96 million barrels per day by 2020. This compares to a consumption of 87.4 million barrels per day today. And, when you factor in the expected decline of about 10.5 million barrels per day from the mature fields around the world, North America's success in this area is significant to global supply.
In addition, new discoveries of oil have led to disappointing results. There was high hope that a small group of countries--Brazil, Russia, Iraq and Kazakhstan, or the BRIKs--would "redraw the world's oil map by boosting their production over the next two decades," says the Financial Times. However, the newspaper reported that Kashagan field in Kazakhstan, "the biggest oil discovery in nearly four decades," will finally begin pumping next year after several delays. Its anticipated flow is about 150,000 barrels per day, then rising to 350,000 barrels a day, but those figures are way below the maximum pumping target of 1.5 million barrels a day.
Yet century-old legislation may be the biggest obstacle to the U.S. becoming a card carrying member of OPEC. Around the time when Henry Ford was selling his Model T to millions of Americans, the government passed the Minerals Leasing Act of 1920, dictating that all U.S. crude exports must get approval from the government before proceeding. At the time, the country had net imports of about 300,000 barrels of oil a day.

Since the 1940s, the U.S. hasn't had to worry about what to do with excess barrels of oil. With the rising use of oil, the country increasingly consumed more of the commodity than it produced. However, over the years, certain types of exports have been allowed, including exports to Canada (not including the crude from the Trans-Alaska Pipeline System, which has other restrictions), exports from Alaska's Cook Inlet, re-exports of foreign origin crude, and exports made under international agreements, says Raymond James.
But other exports are only permitted on a case-by-case basis as they are more dependent on what the government believes is in the nation's best interest. Beyond what's written in the rule books, "there are political overtones to anything that entails presidential discretion," says Raymond James. The firm compares potential oil exports in the future to the experience of natural gas exports today, noting that "utility and manufacturing trade groups are actively lobbying against U.S. liquefied natural gas export permits because, of course, any such exports would incrementally raise domestic gas prices."
In the spirit of economic nationalism, Raymond James believes that "as applications for crude export permits become more common, we would anticipate opposition to emerge, which means that the newly reelected Obama administration will probably suffer political backlash if it signs off on increasing exports of U.S. crude."
The backlash that would result is likely because there is a common misperception between exporting crude and the price of a gallon of gasoline at the pumps, which is based on the Brent price of oil. "The irony here is that U.S. consumers pay a global price for gasoline, and exporting U.S. 'land-locked' light sweet crude would actually help push down the global price of gasoline," according to Raymond James.
"Keeping the 'land-locked' crude in the U.S. does nothing to help domestic consumers, but as we all know, politics and reality can be very different things," says the research firm.
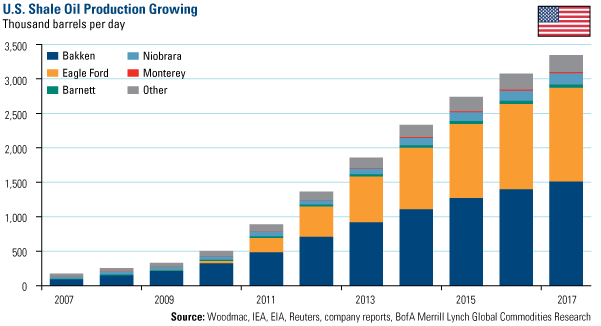
If Washington prevents oil from leaving the country, the likely outcome is that barrels will begin stacking up in the Gulf Coast area. With the significant growth from areas such as the Bakken, Eagle Ford and the Niobrara Formation in Nebraska, Bank of America Merrill Lynch estimates that by 2017, refiners will likely be "saturated with light oil."

How do investors benefit in the near term? Look to U.S. oil refiners, especially those with mid-continent exposure such as HollyFrontier (HFC) and Phillips 66 (PSX), which stand to benefit from these rising trends in production. Refiners have two distinct advantages that help them bring in more profits. One is the fact that the price of WTI oil has been trading at a discount to Brent. In 2012, the spread between WTI and Brent averaged about $17 per barrel. Domestic refiners have access to less expensive crude and benefit from the price differentiation as its refined product is priced closer to Brent. The other big advantage for U.S. refiners is record low prices for natural gas, a commodity used in large quantities by refineries.
The Global Resources Fund (PSPFX) gives investors front seat access to this growth. In its diversified portfolio, there are multiple ways to benefit from the rising supply of oil in the U.S. See the funds’ latest list of top 10 companies here.
For more updates on global investing from Frank and the rest of the U.S. Global Investors team, follow us on Twitter at www.twitter.com/USFunds or like us on Facebook at www.facebook.com/USFunds. You can also watch exclusive videos on what our research overseas has turned up on our YouTube channel at www.youtube.com/USFunds.
By Frank Holmes
CEO and Chief Investment Officer
U.S. Global Investors
U.S. Global Investors, Inc. is an investment management firm specializing in gold, natural resources, emerging markets and global infrastructure opportunities around the world. The company, headquartered in San Antonio, Texas, manages 13 no-load mutual funds in the U.S. Global Investors fund family, as well as funds for international clients.
All opinions expressed and data provided are subject to change without notice. Some of these opinions may not be appropriate to every investor.
Standard deviation is a measure of the dispersion of a set of data from its mean. The more spread apart the data, the higher the deviation. Standard deviation is also known as historical volatility. All opinions expressed and data provided are subject to change without notice. Some of these opinions may not be appropriate to every investor. The S&P 500 Stock Index is a widely recognized capitalization-weighted index of 500 common stock prices in U.S. companies. The NYSE Arca Gold BUGS (Basket of Unhedged Gold Stocks) Index (HUI) is a modified equal dollar weighted index of companies involved in gold mining. The HUI Index was designed to provide significant exposure to near term movements in gold prices by including companies that do not hedge their gold production beyond 1.5 years. The MSCI Emerging Markets Index is a free float-adjusted market capitalization index that is designed to measure equity market performance in the global emerging markets. The U.S. Trade Weighted Dollar Index provides a general indication of the international value of the U.S. dollar.
Frank Holmes Archive |
© 2005-2022 http://www.MarketOracle.co.uk - The Market Oracle is a FREE Daily Financial Markets Analysis & Forecasting online publication.


