


How Gold Miners Can Leverage the Gold Price
Commodities / Gold & Silver Stocks Dec 11, 2012 - 03:00 AM GMTBy: Frank_Holmes

 Gazing into their crystal balls last week, Wall Street firms interpreted differing futures for gold next year. Morgan Stanley awarded gold the “best commodity for 2013” while Goldman Sachs called the end of the metal’s hot streak. After seeing 11 consecutive years of positive performance from gold, one needs to be wary of research analysts’ price forecasts, as they have consistently underestimated the shifting dynamics driving the precious metal higher.
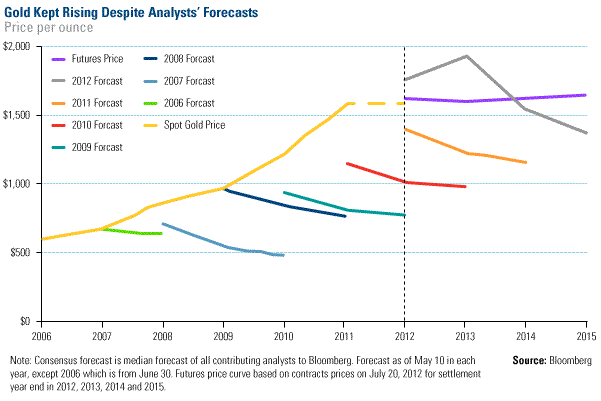
Take a look at analysts’ annual predictions of gold prices, which is “a telling picture,” CEO Nick Holland of Gold Fields told the crowd at a mining conference last summer. From 2006 through 2011, Bloomberg’s contributing analysts have forecasted that future gold prices would be lower. “The analysts who keep telling us the gold price is going down have been wrong seven years out of seven. That’s a remarkable track record!” says Holland.
It is worth keeping gold’s DNA of volatility in mind as the day-to-day price of gold naturally fluctuates, of course. Based on 10 years of data as of September 30, 2012, over any 20 days, there is a 7 percent chance of a 10 percent change in the gold price. Swings have historically been more frequent for gold equities, moving 10 percent up or down about 30 percent of the time over the same time frame.
 The upside to gold stocks is that investors historically have received a 2-to-1 leverage by owning gold equities instead of the commodity. U.S. Global’s Portfolio Manager Brian Hicks reminded The Gold Report readers of this fact during an extensive conversation that he and Portfolio Manager Ralph Aldis had with Brian Sylvester.
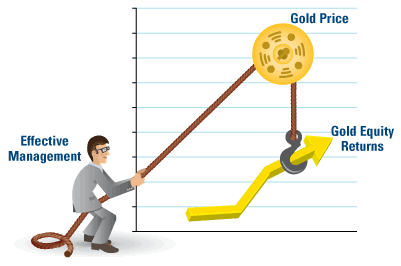
We believe that effective management can help miners gain more leverage over the metal for their shareholders. Picture the gold price as a pulley with gold company executives applying force on one side of a rope. The more disciplined and successful the management, the bigger the potential boost in gold equity returns.
The muscle that gold miners can use to increase their “multiplier effect” for shareholders is three-fold: grow production volume, expand margins or optimize capital, explained Holland. “You want to keep showing that you can increase the return on the mine and that you can increase the cash flow available for shareholders at a particular gold price.”
In recent years, gold mining companies have been facing the dilemma of trying to grow their production profile while also depleting their current resource base. As I explained to Mineweb in a recent podcast, no miner wants to show investors that their production profile is in decline, so there has been a huge push to grow gold production.
However, this “growth for growth’s sake” mind frame has resulted in a congested intersection of projects in the pipeline. Take a look at the chart that National Bank Financial (NBF) put together showing an “unprecedented wave” of projects that mining companies are planning over the next decade. Each dot represents either a gold and precious metals project or a base metals and iron ore project. The bigger the dot, the larger the estimated cost of the project.
The 2006 through 2010 construction history benchmarks the engineering and construction industry’s capacity to build new mines. Relative to the size and number of new projects in the pipeline, the current pool of expertise to build these projects is quite limited.
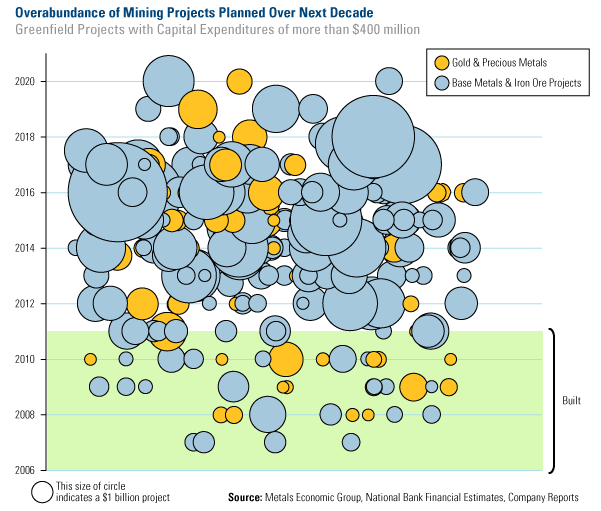
NBF’s mining analysts indicate that about 30 projects can be completed in a two-year time frame.
The critical shortage of technically skilled people has been driving up the cost of projects and resources. “Mines that used to cost $2 billion only a few years ago, now cost $5 billion,” and the beneficiaries of these projects have not been shareholders, but contractors, employees, consultants, governments and equipment suppliers, says Stifel Nicolaus’ George Topping, a well-respected analyst with years of experience in capital markets.
In his research, “Don’t Build It And They Will Come,” he analyzed the projects that four senior miners, Barrick, Goldcorp, Kinross and Newmont, have in the pipeline, looking at the capital expenditures, cash costs and internal rates of return to determine whether he thought the projects should be continued or deferred.
Of the 14 he looked at, only five projects were worth pursuing, in his view. Instead of spending the money on these projects, “senior producers would be able to pay higher dividends, say yielding 5 percent at current prices,” according to Stifel. A monthly or quarterly dividend program shows that gold miners have a pulse and are taking disciplined action in paying back some of their capital.
The Fairytale Land of Cash Costs
The other factor that has been hurting gold miners is the outdated use of a cash costs measure which doesn’t reflect the true costs of mining. In the Mineweb podcast, Ralph and I discussed these “cash cost fairytales,” with Ralph pointing out that only governments believe gold miners have seen a windfall profit from the rising price of gold. He says,
“You’ve got to thank your cash cost marketing for basically taxing 50 percent of your gains away in the form of taxes when the government has risked no capital on the project and not borne any of the risks during the construction of the project.”
Research indicates that an “all-in cost” is much more indicative of the true cost of mining, as it takes into consideration operating costs, sustaining capital, construction capital discovery costs, and overhead tax along with acceptable profit. For example, CIBC’s research calculates that a sustainable number for mining an ounce of gold would be $1,700.
These factors highlight the importance of active management, as gold companies that are successful at executing what they’ve articulated to the public should be more effective at leveraging the price of gold.
In addition, as Brian explains to The Gold Report, “The precious metals market is surprisingly inefficient,” meaning that active investors should be able to take advantage of dislocations in the market.
- Listen to the podcast with Mineweb to hear Ralph and me discuss how mining management is becoming more disciplined.
- See companies we are bullish on by reading The Gold Report interview.
- See U.S. Global’s Special Gold Report on more factors driving miners.
U.S. Global Investors, Inc. is an investment management firm specializing in gold, natural resources, emerging markets and global infrastructure opportunities around the world. The company, headquartered in San Antonio, Texas, manages 13 no-load mutual funds in the U.S. Global Investors fund family, as well as funds for international clients.
Sign up today for our 2013 Outlook webcast at 3 p.m. CT on January 9, 2013. For more on global investing from Frank and the rest of the U.S. Global Investors team, subscribe to the Frank Talk blog, follow us on Twitter at www.twitter.com/USFunds or like us on Facebook at www.facebook.com/USFunds.
The following securities mentioned were held by one or more of U.S. Global Investors Funds as of 9/30/12: Barrick Gold, Goldcorp, Kinross Gold, Newmont Mining
By Frank Holmes
CEO and Chief Investment Officer
U.S. Global Investors
U.S. Global Investors, Inc. is an investment management firm specializing in gold, natural resources, emerging markets and global infrastructure opportunities around the world. The company, headquartered in San Antonio, Texas, manages 13 no-load mutual funds in the U.S. Global Investors fund family, as well as funds for international clients.
All opinions expressed and data provided are subject to change without notice. Some of these opinions may not be appropriate to every investor.
Standard deviation is a measure of the dispersion of a set of data from its mean. The more spread apart the data, the higher the deviation. Standard deviation is also known as historical volatility. All opinions expressed and data provided are subject to change without notice. Some of these opinions may not be appropriate to every investor. The S&P 500 Stock Index is a widely recognized capitalization-weighted index of 500 common stock prices in U.S. companies. The NYSE Arca Gold BUGS (Basket of Unhedged Gold Stocks) Index (HUI) is a modified equal dollar weighted index of companies involved in gold mining. The HUI Index was designed to provide significant exposure to near term movements in gold prices by including companies that do not hedge their gold production beyond 1.5 years. The MSCI Emerging Markets Index is a free float-adjusted market capitalization index that is designed to measure equity market performance in the global emerging markets. The U.S. Trade Weighted Dollar Index provides a general indication of the international value of the U.S. dollar.
Frank Holmes Archive |
© 2005-2022 http://www.MarketOracle.co.uk - The Market Oracle is a FREE Daily Financial Markets Analysis & Forecasting online publication.