Credit Kills the Stocks Bear for December
Stock-Markets / Stock Markets 2012 Dec 11, 2012 - 12:50 PM GMTBy: Clif_Droke

 Stocks remained buoyant this week as the market believes the Fed will remain accommodative in view of the latest drop in U.S. unemployment numbers. It’s widely expected the Federal Reserve will maintain its easy money policy when it meets on Wednesday.
The number of stocks making new 52-week lows has remained under 40 for the last two weeks now and the major indices are all above their rising 15-day moving averages. That shows that the market has stabilized enough to allow rising short-term internal momentum to begin to have a lifting effect on the market.
Elsewhere it was announced today that According to the Federal Reserve, consumer credit increased by $14.2 billion in October. This follows prior month's reading of a $11.4 billion increase, and is higher than the $9.9 billion that had been broadly expected among economists polled by Briefing.com. The increase in consumer credit underscores the continued positive readings in our New Economy Index (NEI), which indicates a positive overall holiday retail sales season for December.
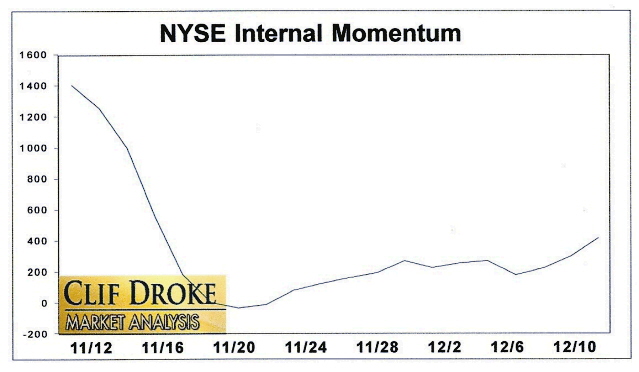
Much of the impetus behind the NYSE market’s short-term strength is coming from the improvement in the short-term internal momentum. Specifically, the short-term directional indicator component of our internal momentum index (HILMO) is gradually turning up. This particular indicator measures the rate of change in the NYSE new 52-week highs and lows, which in turn reflects the incremental demand for stocks. When this particular indicator is rising after being in decline for several weeks, it implies the stock market’s short-term internal path of least resistance is turning up.

There are several indicators which point to the December-January bullish seasonality effect taking root. One such indicator worth mentioning is the euro currency, which has regained its footing after a brief excursion below its 15-day trend line last month. The euro currency ETF (FXE) is now above its rising 15-day MA and is closing in on a quarterly high. That’s a sign that in spite of the continued headline fears surrounding the euro zone, investors aren’t inordinately worried about the fallout in the near term. This in turn should help to create a fairly stable environment for equities in the near term.
In recent years there has been a fairly close relationship between the euro and the short-term direction of the U.S. stock market with the euro currency leading the way in most cases. The most recent example of this relationship was the peak in the euro ETF in late February, which preceded the major peak in the S&P 500 by at least a month. The following graph highlights this relationship and underscores the tendency for strength in the euro to beget strength in U.S. equities.
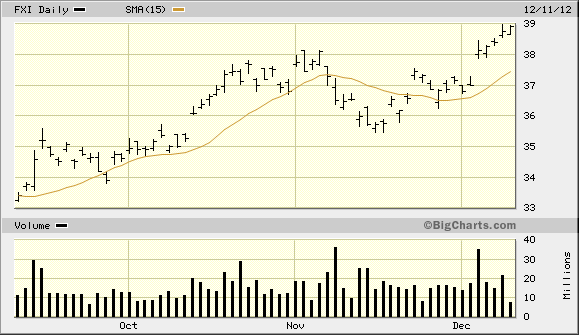
The next example of a leading indicator is the China 25 Index Fund ETF (FXI), which has also been a leading indicator of sorts for the S&P in recent years. FXI made a new multi-month high today and is feeding off strong internal momentum currents within its sector.

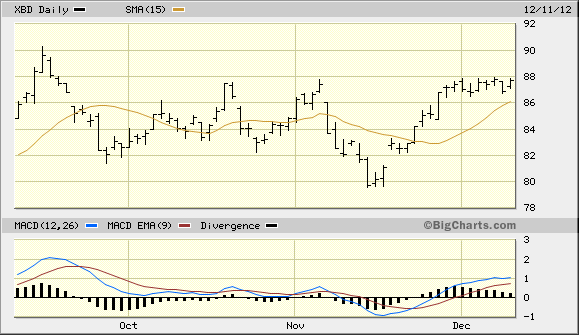
Another favorable indicator is the recent strength in the NYSE Broker/Dealer Index (XBD). When this sector shows leadership it typically bodes well for the broad market outlook. XBD has not only recovered above its rising 15-day MA, it’s also closing in on a fresh 3-month high and looks to soon test, if not overcome, its previous high from September.

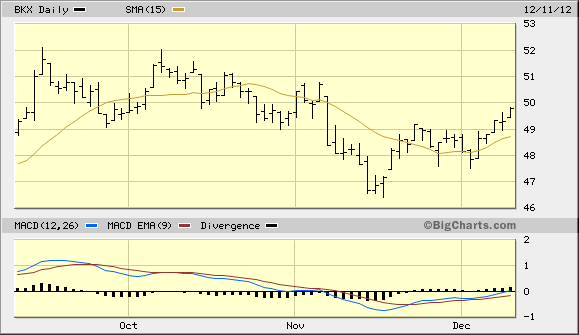
I would add to this observation the recent improvement in the Bank Index (BKX), another important gauge of broad market strength. Note the improvement in the 15-day moving average as well as the positive MACD structure in the following chart.

Another bright spot on the immediate horizon is the mid-cap stocks. Unlike the SPX chart, the technically significant 30-day and 60-day moving averages for the S&P 400 Midcap Index (MID) have both flattened out and are on the verge of turning up. The MID is also above both moving averages as of this writing. Stock Trader’s Almanac tells us that the small-cap and mid-cap stocks tend to start outperforming beginning around the middle of December. This is something we’ll be watching closely in the days ahead. If the NYSE short-term internal momentum index turns up and gives us the anticipated buy signal we’ll likely see the next tradable move in the mid-caps, which has the best chart of any of the major indices.
On the investor psychology front the latest AAII investor sentiment statistics showed a 1% increase in both the bulls and bears from last week. The bullish percentage rose to 42% and the bearish percentage rose to 35%. Granted there are more bulls than bears, which from a contrarian perspective is sometimes troubling, but this is actually a normal progression from an excessively bearish psychology last month. Only when the percentage of bulls starts to approach 50% will we need to be concerned.
Here are the newsletter advisory sentiment figures from Investors Intelligence. The editors at Investors Intelligence largely agree with my take on the AAII sentiment numbers: “There was an increase for the BULLS to 43.6%, from 39.3 %. At present the BULL count is not a danger sign, and could grow further before becoming a concern. Showing their largest weekly change in almost four months, the BEARS fell to 25.5%. With more BULLS and fewer BEARS, the SPREAD between them jumped to 18.1%. The current increase is normal and not a problem until it nears that almost 30% reading again.”
2014: America's Date With Destiny
Take a journey into the future with me as we discover what the future may unfold in the fateful period leading up to - and following - the 120-year cycle bottom in late 2014.
Picking up where I left off in my previous work, The Stock Market Cycles, I expand on the Kress cycle narrative and explain how the 120-year Mega cycle influences the market, the economy and other aspects of American life and culture. My latest book, 2014: America's Date With Destiny, examines the most vital issues facing America and the global economy in the 2-3 years ahead.
The new book explains that the credit crisis of 2008 was merely the prelude in an intensifying global credit storm. If the basis for my prediction continue true to form - namely the long-term Kress cycles - the worst part of the crisis lies ahead in the years 2013-2014. The book is now available for sale at: http://www.clifdroke.com/books/destiny.html
Order today to receive your autographed copy and a FREE 1-month trial subscription to the Gold & Silver Stock Report newsletter. Published twice each week, the newsletter uses the method described in this book for making profitable trades among the actively traded gold mining shares.
By Clif Droke
www.clifdroke.com
Clif Droke is the editor of the daily Gold & Silver Stock Report. Published daily since 2002, the report provides forecasts and analysis of the leading gold, silver, uranium and energy stocks from a short-term technical standpoint. He is also the author of numerous books, including 'How to Read Chart Patterns for Greater Profits.' For more information visit www.clifdroke.com
Clif Droke Archive |
© 2005-2022 http://www.MarketOracle.co.uk - The Market Oracle is a FREE Daily Financial Markets Analysis & Forecasting online publication.


