


Stock Market Update: Know When to Hold ‘Em
Stock-Markets / Elliott Wave Theory Feb 24, 2008 - 08:21 PM GMTBy: Dominick

This continues to be a trader's market, no doubt about it. When it takes three months for the market to swing a hundred points in any one direction, but you can get 30 points in an hour, this is clearly not time to buy and hold.
The problem for many, though, is that they simply don't know how to trade short time frames and most subscription services don't specialize in real time analysis. Not so with TTC! Read on to see how we traded this past Friday and what it really means to be unbiased in this topsy-turvy market.
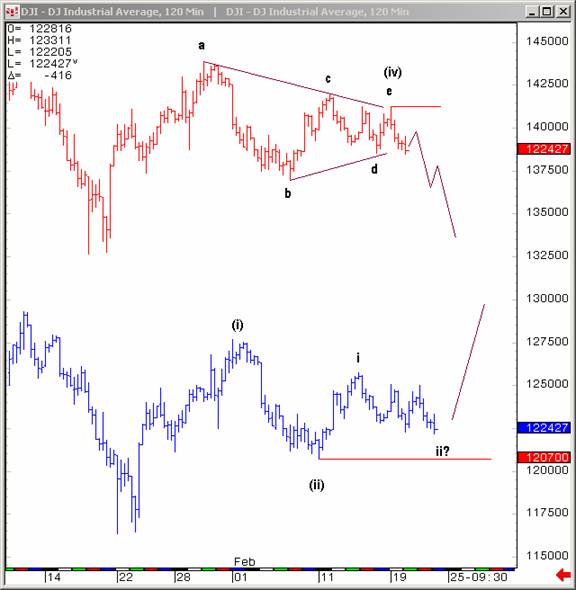
The chart above was posted Friday morning and shows the operative bullish and bearish counts. Naturally, the bears traded the top chart and the bulls traded the bottom one. But only TTC traded both!
First, the top count kept us short into our proprietary target at 1333, where we got out of the trade. The market then spent the rest of the day vibrating around this level and members were advised to stay out of the chop and wait for a new low that would launch the rally suggested in the bull chart. As you know, that low appeared in the final hour on Friday and, believe it or not, we were there buying with open arms.
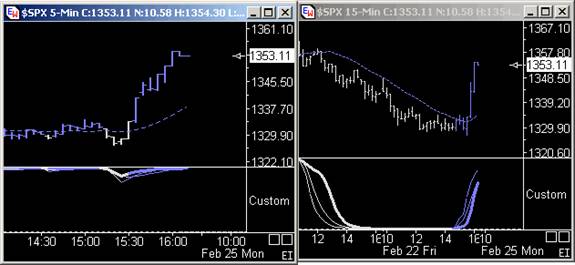
This charts above our proprietary 5 and 15 min trend cycle indicator. As you can see, the 5min remained pegged to the top of its trend channel from early afternoon, just one more reason TTC members knew not to be fooled by the selling. Once the 15min started to pop at the lows, members had their trigger that was agreeing with what I posted just a couple of hours before. I had posted the following statement, “ if there was ever a bear trap, it's soon ”. So as you see, TTC was ready, were you? There's always news offered after a major move like the one that materialized late Friday, but when technical analysis consistently predicts the reaction before the news is released it's hard to believe the news is what's really driving the moves.
To be fair, I didn't expect the full extent of the rally to happen so quickly. But, members knew my immediate target was at least above 1342 and when a surge appears with such momentum, we always respect it and move our target upwards, 1352 in this case. It looks like next week, we'll again be in the vicinity of 1360, a number I first introduced in 2006 and which has again been guiding this market for the past few months. It continues to be a number to watch.
But, on the strength of the manic short-covering surge that no one thought could happen earlier in the day, we cashed out into the weekend very pleased. We never thought the bears' 3 of 3 of 3 down was a foregone conclusion, and it looks like when it finally appeared on Friday it was moving in the wrong direction! The bulls took advantage of a fairly immaterial rumor that could totally unravel next week if the large triangle remains in play. In all, the late rally was another example of how you could loose your entire week in a few minutes, and why it's pointless to rely on weekly updates when the market evolves so quickly. But stay tuned, the unbiased will profit in any environment because they know when to hold ‘em … and when to trade.
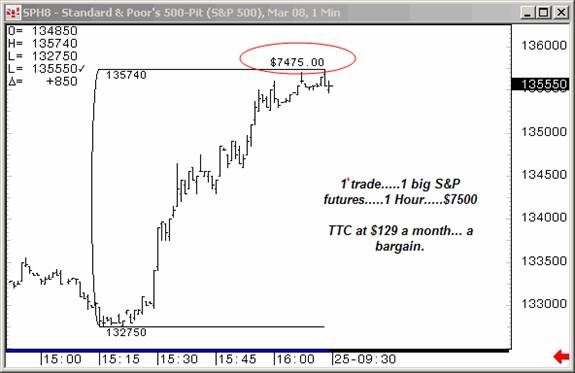
If you're thinking twice about paying for a reliable service, consider the chart above which shows the bargain TTC members find week in and week out.
So, do you want to learn how to trade short term time frames? Would you like access to next week's charts posted in the weekly forum right now? Twenty to thirty big picture charts are posted every weekend in many markets, here is an example of a few past ones. If you feel the resources at TTC could help make you a better trader, don't forget that TTC will be closing its doors to retail members this year. Institutional traders have become a major part of our membership and we're looking forward to making them our focus.
TTC is not like other forums, and if you're a retail trader/investor looking to improve your trading, you've never seen anything like our proprietary targets, indicators, real-time chat, and open educational discussions. But the only way to get in is to join before the lockout starts – once the doors close to retail members, we'll use a waiting list to accept new members from time to time, perhaps as often as quarterly, but only as often as we're able to accommodate them. Don't get locked out later, join now.
Have a profitable and safe week trading, and remember:
"Unbiased Elliott Wave works!"
By Dominick , a.k.a. Spwaver
www.tradingthecharts.com
This update is provided as general information and is not an investment recommendation. TTC accepts no liability whatsoever for any losses resulting from action taken based on the contents of its charts, commentaries, or price data. Securities and commodities markets involve inherent risk and not all positions are suitable for each individual. Check with your licensed financial advisor or broker prior to taking any action.
Dominick Archive |
© 2005-2022 http://www.MarketOracle.co.uk - The Market Oracle is a FREE Daily Financial Markets Analysis & Forecasting online publication.