


Using a Put Butterfly to Options Trade Cummins Inc.
Companies / Options & Warrants Dec 22, 2012 - 03:17 AM GMTBy: J_W_Jones

 Entomologists tell us that a group of butterflies can, at the choice of the writer, be termed a lek, a rabble, or a swarm. I was first struck today by the bearish Fibonacci based pattern initially described by Larry Pesavento termed a bearish butterfly which had completed in heavy engine manufacturer Cummins Incorporated (symbol CMI).
As improbable as it might be, I was pleased to find that a high probability option structure that could be used to trade it, the put butterfly. I thought it would be interesting to examine for educational value this rabble.
First, let’s look at the chart pattern. The price pattern termed a butterfly is a high probability reversal pattern that can occur in both bullish and bearish configurations. It is a variant of a two step pattern and also a variant of a more commonly known Fibonacci pattern, the Gartley.
The essential elements of the pattern are an initial impulsive thrust (classically termed the X:A leg), a reversal of 0.618 to 1.00 of the initial thrust (the A:B leg), a second thrust in the direction of the initial leg (the B:C leg), and the final reversal thrust opposite in direction from the initial X:A leg extending from 1.272 to 1.618 of the initial leg.
Verbal descriptions are confusing, but consider the characteristic visual pattern which is easily recognized once the trader is familiar with the pattern.
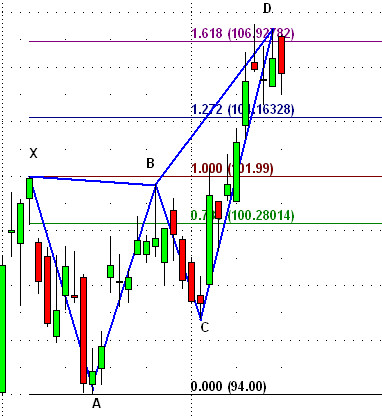
The pattern completed last Friday as indicated on the graph, and today’s bearish candle constitutes a trigger for the trade. These patterns have approximately a 67% probability of success.
The option position I chose to trade this pattern is that of a classic put butterfly. For those not familiar with this structure it is a three legged structure that is composed of long positions for the wings and a short position for the body.
The classic butterfly is always constructed in the ratio �2/+1 and the long positions are equi-distant from the short position comprising the body. The position is a debit position meaning that money is deducted from the buying power of the account.
An option butterfly can be constructed using either puts or calls. It is important to understand that the maximum profitability of these trade structures occurs when price is at the strike of the body at expiration. Therefore, if an individual butterfly is constructed to express a directional bias, it can be constructed using either puts or calls since the strike price of the body determines maximum profitability.
As an aside, variations of a classic butterfly do exist. Two commonly encountered variants are an iron butterfly and a broken wing butterfly. The iron butterfly is a credit trade and is constructed using both puts and calls.
The broken wing butterfly is built by buying the long options at different distances from the central body. We will discuss these less common positions as different trading opportunities are presented to us.
To return to our current situation in CMI, I chose a put butterfly using the 90/100/110 strike prices in the January series. I chose January because December expiration is only a few days away, and butterflies work best when given a bit of duration.
Had weekly options been available for this underlying, I likely would have chosen to use them in order to tailor the time frame a bit shorter to allow a faster response to changes in P&L.
The P&L graph of this put butterfly is presented below.
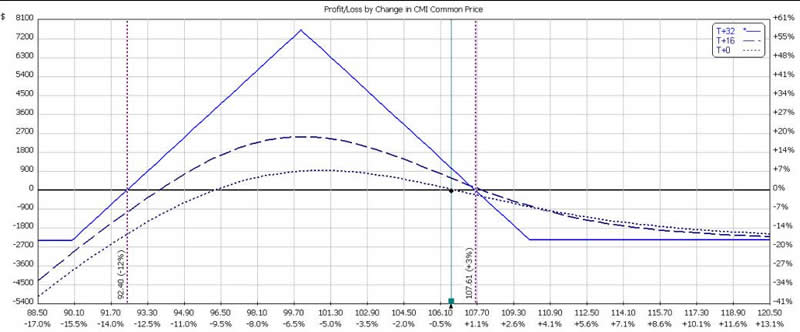
Pay particular attention to the intermediate time curves indicated by the two broken lines in relation to the expiration curve indicated by the solid blue line. The broken lines represent the P&L today (the lower broken line) and halfway to expiration (the higher broken line). Note that the butterfly only reaches its maximum profitability at expiration.
Another characteristic is the difference in slope of the intermediate and expiration lines. While the intermediate time frames react gently to changes in price, the pace of reaction to price change increases dramatically as expiration approaches.
It is for this reason that many option traders routinely close their butterfly positions ahead of expiration. Most experienced butterfly traders do not allow their positions to go to expiration because of the position risk with adverse price moves.
We welcome you to try our service to learn about more high probability trade set ups and option positions to extract potential profits while defining risk precisely.
 If you are looking for a simple one trade per week trading style then be sure to join www.OptionsTradingSignals.com today with our 14 Day Trial.
J.W. Jones is an independent options trader using multiple forms of analysis to guide his option trading strategies. Jones has an extensive background in portfolio analysis and analytics as well as risk analysis. J.W. strives to reach traders that are missing opportunities trading options and commits to writing content which is not only educational, but entertaining as well. Regular readers will develop the knowledge and skills to trade options competently over time. Jones focuses on writing spreads in situations where risk is clearly defined and high potential returns can be realized.
This article is intended solely for information purposes. The opinions are those of the author only. Please conduct further research and consult your financial advisor before making any investment/trading decision. No responsibility can be accepted for losses that may result as a consequence of trading on the basis of this analysis.
© 2005-2022 http://www.MarketOracle.co.uk - The Market Oracle is a FREE Daily Financial Markets Analysis & Forecasting online publication.