Gold 1980 Top is Key Reference Point for Precious Metals Investors
Commodities / Gold and Silver 2013 Dec 27, 2012 - 11:40 AM GMTBy: P_Radomski_CFA
 This essay is inspired by a question we received from one of our subscribers. On December 2012, we published an essay on gold and the dollar collapse in which we pointed out why you might profit from gold even if the U.S. dollar doesn't deteriorate completely. Today, we will elaborate on why we actually use the 1980 top in comparisons.
The fact that nobody really knows with absolute certainty where gold will really go from today onward makes people try to make their own guesses about what can happen with the yellow metal. One of the methods to do that is to look back into past situations and try to estimate if what is happening now is somehow similar to those past events.
In fact, history doesn't repeat itself precisely. What happened once doesn't come back in exactly the same way. Because of that the future is not something that is completely predictable and those who aim to predict it (for instance analysts and investment tools). But what happens now can be similar to what has happened before. J.R. Colombo wrote "'History never repeats itself but it rhymes,' said Mark Twain". It may be possible that some patterns repeat themselves. The same goes for everything that's happening with gold. And even if past patterns don't give you any certainty, sometimes they can limit the uncertainty.
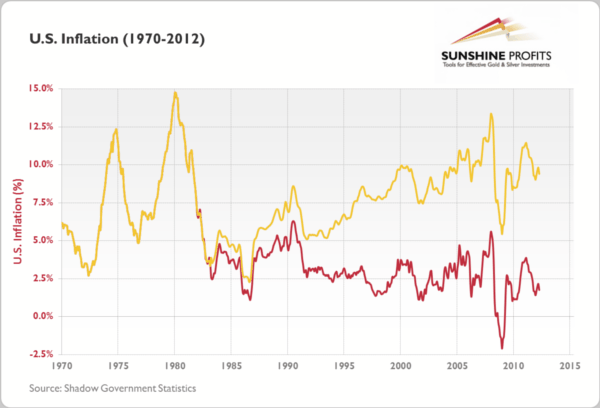
The situation in the gold market today is different than that one in 1980 in a few important areas. Let us analyze that in more detail. The chart below presents U.S. inflation figures.

The red line represents official inflation data as published by the Bureau of Labor Statistics. The gold line represents the inflation data calculated according to the methodology used in 1980. There is visible divergence between the two lines after 1980, and particularly after 1985.
Let's focus on the 1977-80 period. The annual inflation rate went up from 5.2% in January 1977 to 14.8% in March 1980. This rise was partially due to the deteriorating political situation in Iran, one of the OPEC nations. In early 1979, Iran saw a revolution which resulted in political power being shifted from the Shah of Iran to a religious leader, Ruhollah Khomeini. In the wake of the revolution, oil exports fell, curtailing global supply and driving prices of oil higher which, in turn, fueled the rise in prices of many other goods.
This is, however, only part of the story. OPEC countries increased oil supply to compensate for shortages but the oil crisis was exacerbated by an embargo on Iranian oil imposed by U.S. President Jimmy Carter following an incident in the U.S. Embassy in Teheran, where more than 60 U.S. citizens had been taken hostages. With the embargo in place and public panic about the availability of oil, buyers rushed to acquire oil while they could. Increased demand caused even further increases in prices, and so the cycle continued. This is quite important as it shows that the effects of adverse events can be worsened by crowd behavior.
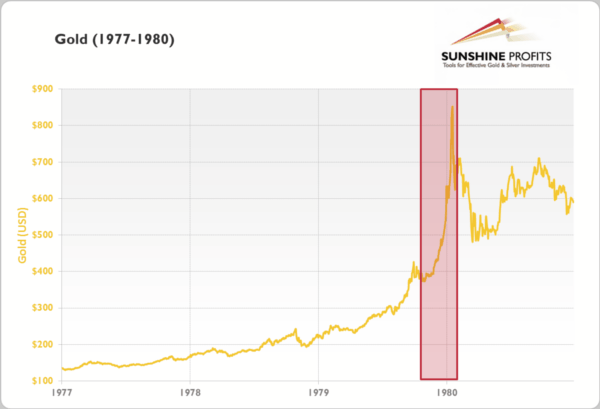
From January 4, 1977 to January 21, 1980 the price of gold rose from $135.70 to $850 (526.4%), partially fueled by soaring inflation. Let's take a closer look at this bull market.

It is particularly worth noting that even though the bull market had started long before 1980, most significant appreciation (in dollar terms) occurred in December 1979 and January 1980 when prices went up from $428.25 (December 3, 1979) to $850 (January 21, 1980). In percentage terms, this last period is slightly less spectacular, but the point here is that the very end of the bull market saw the most significant appreciation in the yellow metal and that the price of gold followed a path of "exponential" growth during this period.
This period of exponential growth was partially triggered by the fact that on December 24, 1979 the Soviet army invaded Afghanistan starting what would escalate to a 10-year-long war. This event, combined with the abovementioned second oil crisis and soaring inflation in the U.S., sent commodity prices sky high. But, once again, this is not the whole story. Namely, inflation and the Soviet war in Afghanistan were decisive in triggering the final rally, but it were emotional reasons that made investors and speculators rush for gold and amplified the price moves.
It is also worth noting that, once the panic about inflation and the war in Afghanistan was over, gold retraced back to as low as $485.25 as soon as on March 27, 1980. So the craze started in December the previous year and lasted for only about four months. And this relatively short period seems to be defining how people perceive the 1980 bull market now.
Now, let's make a quick comparison between 1980 and the current bull market. Back in 1980 official inflation numbers were two-digit, while today they stand at approximately 0% (official data) or 4-10% (inflation calculated according to methodologies which were in place in 1980 or 1990). In 1980 the scare of the Soviet war in Afghanistan was an important factor. Today, the situation in Iraq has been getting less and less attention, particularly since the U.S. withdrew its military personnel from the country in December 2011.
So, there doesn't seem to be a war in the equation, and the current economic environment is deflationary rather than inflationary (official figures). On the other hand, alternative inflation figures suggest that that environment is not as deflationary as one might think. But, all in all, the situation today is in fact very different than it was in 1980. So why do we even use the 1980 top in comparisons?
First of all, even though we don't see inflation eating away at our pockets doesn't necessarily imply that there uncertainty about the economy is limited. Right now, with unemployment at 7.7% and with a debt pile larger than GDP and growing, the U.S. economy doesn't look deprived of uncertainty. To pay off such amounts of debt the economy either needs to start growing or the government can inflate the debt away. So, even though the inflation as seen in 1980 is definitely not here, it is at least possible (and in our opinion - likely) that it will materialize in the future.
Secondly, if the economic situation suddenly deteriorates, we could experience effects similar to the ones seen in 1980 because of the Soviet war in Afghanistan (unlikely but possible). Even if financial turmoil brought gold temporarily lower as in 2008, it seems conceivable that such an event would be followed by strong appreciation of both gold and silver.
Finally, and probably most importantly, even if we don't see considerable inflation or the deterioration of the dollar, we still seem to be in a long-term bull market. This bull market can continue to unfold as in the last decade, quite differently than the 1977-80 appreciation in gold but human emotions haven't changed that much since 1980. So, in the third phase of the bull market, when everybody would want to own gold, we might see a similar "exponential" price growth pattern. Actually, the events could play out a lot quicker than they did in 1980.
The 1980 serves as a reference point but right now the audience that might want to take interest in precious metals is a lot broader than it was back in 1980. As we pointed out in our essay on gold and the dollar collapse, right now there is no Iron Curtain to prevent people from Central and Eastern Europe to take part in the bull market. China and India are developing and investors from these countries may fuel the bull market as well. You can read more on that topic in our report on gold in India. What is more, right now it's a lot easier to manage your money than in was in 1980. Taking or reversing your positions in gold is a matter of seconds and minutes and not hours or days. Because of that, it is possible for any rally in the end stage of the bull market to be even more pronounced than it was in 1980.
To sum up, we use the 1980 top for comparisons not because the current economic situation is very similar to the one in 1979-80. In fact, it's very different in some crucial areas, but the key point is the same - the fundamental situation was positive for gold in 1970s and it is the case right now. We use because it seems that human nature and emotionality hasn't really changed since 1980. We still can see a period of "crazy buying" at the end of the bull market. What has changed, though, is the number of people that can participate in the bull market and the technological infrastructure. Because of that, the 1980 top can only be used as a general reference point and not as a precise target. The changes in the markets may make the final rally of this bull market significantly more volatile than it was in 1980.
Thank you for reading.
If you enjoyed this essay, we invite you to read our other free commentary on gold or to take a look at our gold reports.
Przemyslaw Radomski, CFA
Founder, Editor-in-chief
Gold & Silver Investment & Trading Website - SunshineProfits.com
* * * * *
About Sunshine Profits
Sunshine Profits enables anyone to forecast market changes with a level of accuracy that was once only available to closed-door institutions. It provides free trial access to its best investment tools (including lists of best gold stocks and best silver stocks), proprietary gold & silver indicators, buy & sell signals, weekly newsletter, and more. Seeing is believing.
Disclaimer
All essays, research and information found above represent analyses and opinions of Przemyslaw Radomski, CFA and Sunshine Profits' associates only. As such, it may prove wrong and be a subject to change without notice. Opinions and analyses were based on data available to authors of respective essays at the time of writing. Although the information provided above is based on careful research and sources that are believed to be accurate, Przemyslaw Radomski, CFA and his associates do not guarantee the accuracy or thoroughness of the data or information reported. The opinions published above are neither an offer nor a recommendation to purchase or sell any securities. Mr. Radomski is not a Registered Securities Advisor. By reading Przemyslaw Radomski's, CFA reports you fully agree that he will not be held responsible or liable for any decisions you make regarding any information provided in these reports. Investing, trading and speculation in any financial markets may involve high risk of loss. Przemyslaw Radomski, CFA, Sunshine Profits' employees and affiliates as well as members of their families may have a short or long position in any securities, including those mentioned in any of the reports or essays, and may make additional purchases and/or sales of those securities without notice.
Przemyslaw Radomski Archive |
© 2005-2022 http://www.MarketOracle.co.uk - The Market Oracle is a FREE Daily Financial Markets Analysis & Forecasting online publication.


