


Stocks Bear Market Ahead?
Stock-Markets / Stock Markets 2013 Dec 30, 2012 - 09:55 AM GMTBy: Tony_Caldaro

 The US market opened lower to start the week, continued lower for much of the holiday shortened week, and ended giving back all of last week’s gains. For the week the SPX/DOW -1.9%, and the NDX/NAZ were -2.1%. Asian markets gained 1.8%, European markets lost 0.7%, and the DJ World index lost 0.7%. On the economic front positive reports continued to outnumber negative reports: 7 to 2. On the uptick: Case-Shiller, new/pending home sales, new home prices, the Chicago PMI, the WLEI and weekly jobless claims improved. On the downtick: consumer confidence, and the monetary base. Next week the monthly Payrolls report, ISM and Auto sales. Best your week!
Stock Market Overview
With the bull market stumbling we decided to take a look at the leading sectors that have supported this bull market. Leading sectors shift from one group to another group in alternating bull markets. This bull market’s leaders have been the Techs and Industrials, naturally, plus Consumer discretionary (XLY) and staples (XLP).
Typically when a bull market nears its end, the leading sectors are usually displaying five wave patterns up, from the bear market lows, and then start to head lower. A quick review of XLY, XLP and the NDX for techs displays this potential pattern. The industrial DOW will follow shortly:
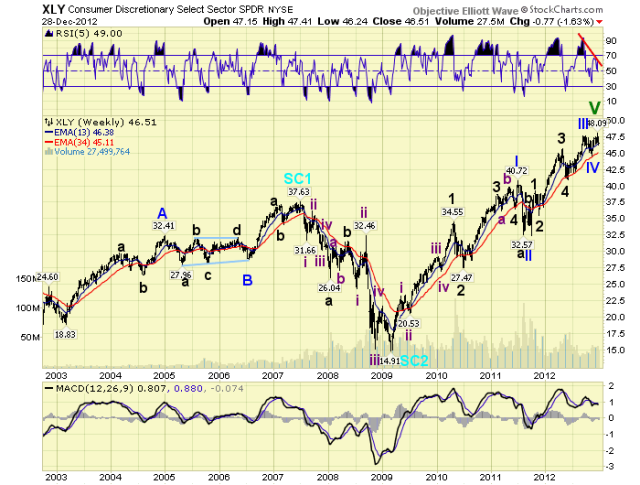
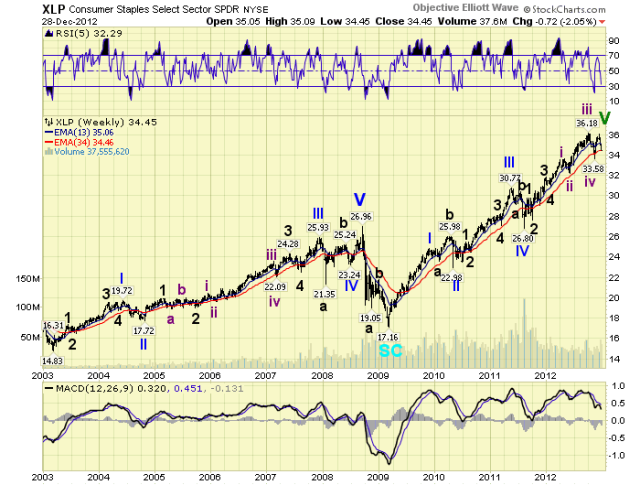
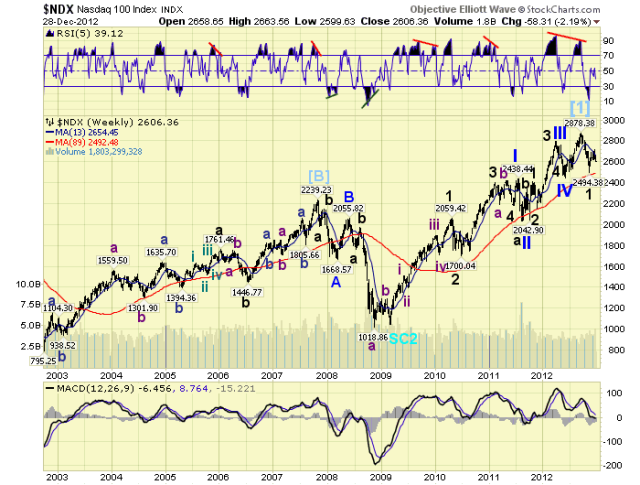
Notice, the XLP and XLY appear to be in their last bull market uptrend, (green label). While the NDX already appears to be in a potential bear market. Other sectors of interest, that have already been displaying weakness are the: Transports (DJT), Russell 2000 (R2K), NY stock exchange index (NYA), and the Semiconductors (SOX). All of these indices peaked in 2011, sold off sharply, and then have failed to make higher highs in 2012. The most disturbing of these four indices is the SOX.
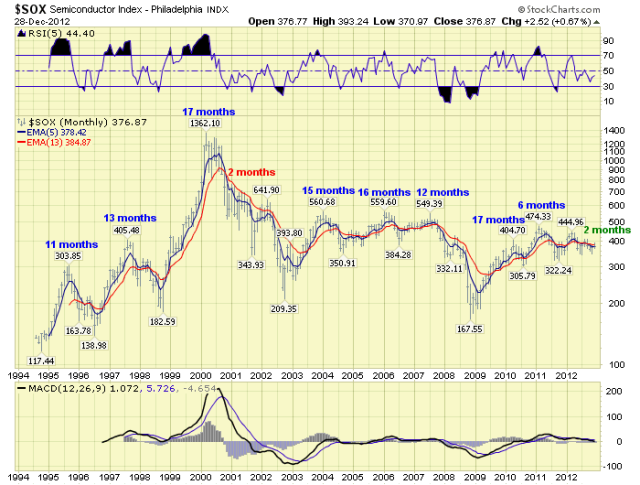
Every even year, without exception, the semiconductors put in a two year cycle low. These lows typically lead to a 50%+ gain, in the SOX index, over the next six to seventeen months. The only exception was during the 2000-2002 bear market. Then the SOX rallied for two months, rolled over, and re-joined the general bear market. In June of this year we identified the two year cycle low, and the SOX index started to surge. After two months, however, it lost upside monentum and has remained in a trading range for the past four months. The last time the SOX displayed this kind of activity, after a two year cycle low, was during a bear market. This overview suggests we are entering a bear market.
LONG TERM: bull/bear inflection point still 50/50
For the past few years we have been expecting this bull market to unfold in five Primary waves up from the March 2009 SPX 667 low. We assumed, naturally, it would be five impulse waves, similar to what is displayed in the NDX/XLP/XLY charts. We counted Primary waves I and II complete in 2011, and Primary III underway from that SPX 1075 low. Primary I divided into five Major waves, with a subdividing five Intermediate wave Major wave 1. When Primary III appeared to be advancing in a similar wave pattern, the bull market appeared to be on track. Then some odd events began to occur.
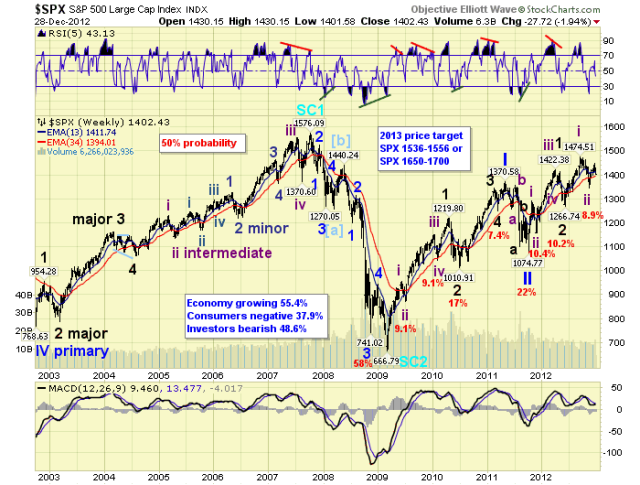
When the FED introduced QE 3 in September, instead of a soaring market, like we observed during QE 1 and QE 2, the market peaked two days later at SPX 1475 and entered a downtrend. This put us on alert to look for an alternate pattern. Recently the FED doubled QE 3 to $85 bln/mth, and the market topped 4 days later at SPX 1448. In mean time the government is playing politics, of course, with the so-called ’fiscal cliff’.
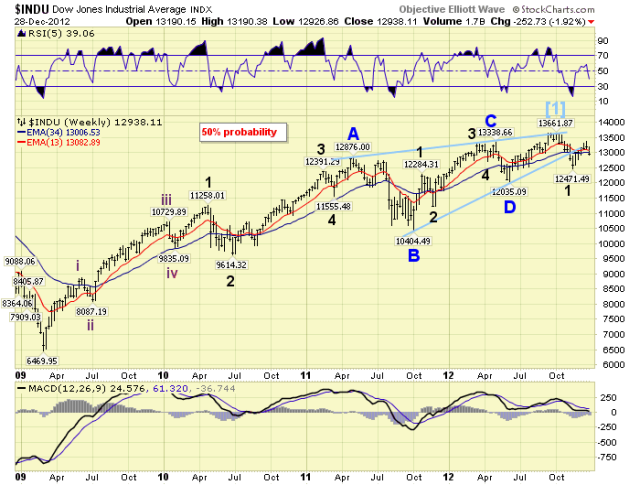
The alternate bearish count, we arrived at in early November, suggests the market has already completed five waves up to end the bull market. The wave pattern, however, is unlike the NDX/XLP/XLY. It is more like a rising, elongated, ABCDE diagonal triangle. These types of patterns also end long term uptrends. But usually with a sudden thud to the downside. At first we gave this count a probability of only 20%. Then it was raised to 30% in mid-November, 40% in early December, and then 50% as of last weekend.
MEDIUM TERM: uptrend in jeopardy
We had suggested near the November SPX 1343 downtrend low, an uptrend should follow to at least SPX 1434-1462. When that occurred, defensive measures should be taken such as hedging or lightening up one’s long positions. When the market reached that zone, it should either break through to resume the bull market, or fail in that zone, and begin a bear market. Three weeks ago the SPX entered the zone, hitting 1439, and was turned away. Two weeks ago the SPX tried to break through the zone again, hitting the exact middle at 1448, and was turned away again. This is not a good sign for the bullish scenario.
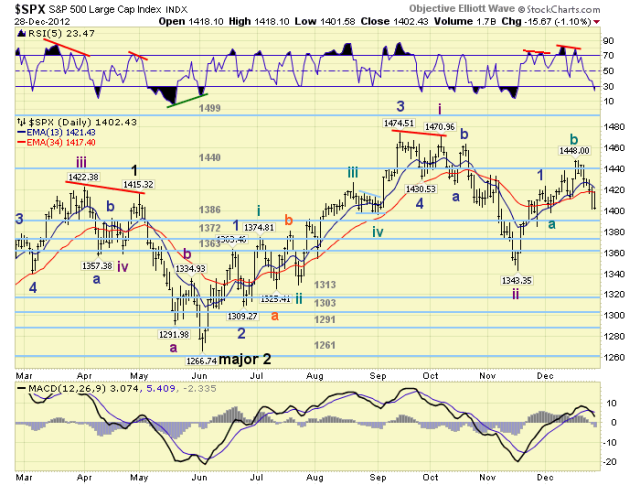
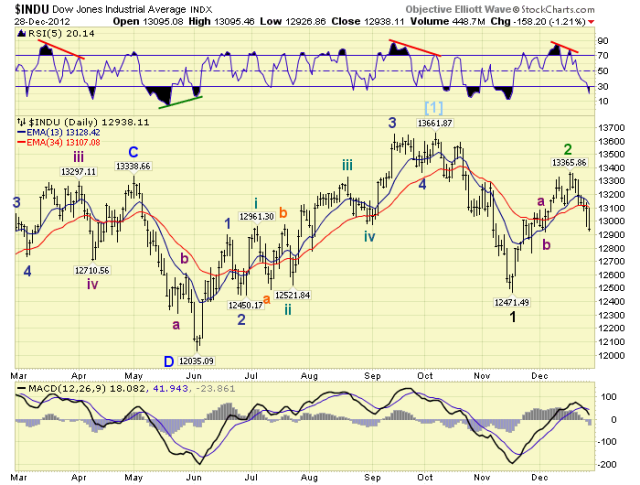
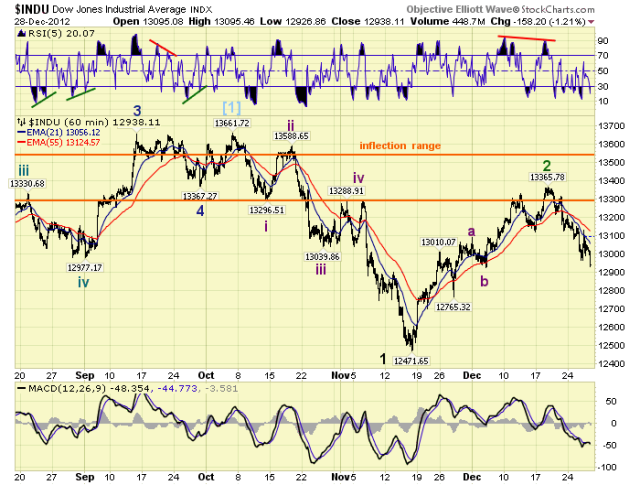
The internal count, for the current uptrend, started off impulsing: five waves up to SPX 1424, a pullback, and then rising again. After hitting SPX 1448, however, it started to get choppy. What followed was a small pullback to SPX 1433, which overlapped 1439, then a failed rally to 1444. This suggested a failed fifth wave diagonal C wave, with the A wave at SPX 1424, and the B wave at 1398. A corrective uptrend! The market has since declined to SPX 1402, where it closed on friday. A similar corrective count was being tracking on the DOW charts.
Under the bullish scenario the SPX uptrend still has the potential to resume the bull market. The rally to SPX 1424 can still be counted as Minor wave 1, of Intermediate iii, and the action since then an irregular Minor wave 2. See SPX chart above. The market, however, has to rally very very soon to avoid a downtrend confirmation.
SHORT TERM
Short term support is at SPX 1402/03, 1396/98 and the 1386 pivot, with resistance at SPX 1413/16, 1422/27, and the 1440 pivot. Short term momentum ended the week oversold. The short term OEW charts remain negative from around SPX 1430, with the swing level now at 1421.
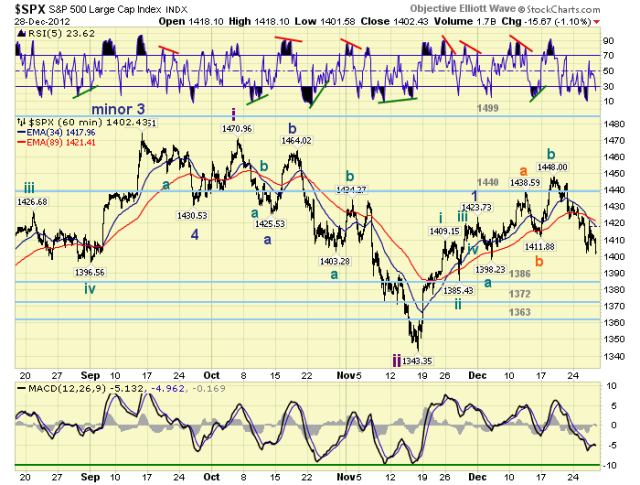
After reviewing our two methods of counting short term waves we find it quite difficult to count the rise from SPX 1343 to 1448 as a completed impulse wave. The count posted on the SPX charts could fit, as well as, the count posted on the DOW charts. The recent decline from SPX 1448-1402, the largest of the uptrend, has altered out bullish short term count quite a bit, while reinforcing the bearish count.
The important levels to observe heading into next week at now SPX 1398 and the OEW 1386 pivot. A break below SPX 1398 would suggest a downtrend is underway. A decline to the 1386 pivot would nearly solidify it. Since we expected this uptrend to make much higher new highs, to keep the bull-case alive, a downtrend would swing the probabilities in favor of a bear market. To avoid a downtrend this market needs to start rallying by at least mid-week. For investors, a defensive position appears appropriate. Best to your trading, and Happy New Year!
FOREIGN MARKETS
The Asian markets were all higher on the week gaining 1.8%. Only Indonesia remains in a downtrend.
The European markets were mostly lower on the week losing 0.7%. All indices still uptrending.
The Commodity equity group were mostly lower but gained 0.2%. All uptrends here as well.
The DJ World indes is still uptrending, but lost 0.7% on the week.
COMMODITIES
Bond prices continue to downtrend but gained 0.4% on the week.
Crude continues its uptrend gaining 1.8% on the week.
Gold’s downtrend continues, but it gained 0.1% on the week.
The USD remains in a downtrend, but gained 0.1% on the week. The uptrending EURUSD gained 0.2%, but the downtrending JPYUSD lost 2.0%.
NEXT WEEK
The markets will be open for trading on monday, but will be closed for the New Year holiday on tuesday. Wednesday: ISM manufacturing, Construction spending and Auto sales. Thursday: weekly Jobless claims and the ADP index. Friday: the Payrolls report, Factory orders and ISM services. The FED will release the FOMC minutes on thursday. Then on friday, vice chair Yellen gives a speech on Systemic Risk in the afternoon. Another potentially critical week ahead. Best to you and yours this holiday season, and Happy New year!
CHARTS: http://stockcharts.com/...
http://caldaroew.spaces.live.com
After about 40 years of investing in the markets one learns that the markets are constantly changing, not only in price, but in what drives the markets. In the 1960s, the Nifty Fifty were the leaders of the stock market. In the 1970s, stock selection using Technical Analysis was important, as the market stayed with a trading range for the entire decade. In the 1980s, the market finally broke out of it doldrums, as the DOW broke through 1100 in 1982, and launched the greatest bull market on record.
Sharing is an important aspect of a life. Over 100 people have joined our group, from all walks of life, covering twenty three countries across the globe. It's been the most fun I have ever had in the market. Sharing uncommon knowledge, with investors. In hope of aiding them in finding their financial independence.
Copyright © 2012 Tony Caldaro - All Rights Reserved Disclaimer: The above is a matter of opinion provided for general information purposes only and is not intended as investment advice. Information and analysis above are derived from sources and utilising methods believed to be reliable, but we cannot accept responsibility for any losses you may incur as a result of this analysis. Individuals should consult with their personal financial advisors.
Tony Caldaro Archive |
© 2005-2022 http://www.MarketOracle.co.uk - The Market Oracle is a FREE Daily Financial Markets Analysis & Forecasting online publication.