


Learn How to Label Elliott Waves More Accurately
InvestorEducation / Elliott Wave Theory Jan 01, 2013 - 09:52 AM GMTBy: EWI

 Are you looking for an easy way to improve your confidence as you analyze the charts you trade? Take a quick look at this chart (adapted from Jeffrey Kennedy's December 26 Elliott Wave Junctures lesson) to see how divergence relationships help clarify your analysis.
According to Jeffrey, divergence relationships are easy to identify. Whenever prices make a new extreme, look for underlying indicators to move in the opposite direction. Specifically,
The momentum relationship most often seen in waves 3 and 5 is divergence. Bullish divergence forms when prices make a new low while an accompanying indicator does not. Conversely, bearish divergence occurs when prices register a new high while an accompanying indicator does not. Bullish and bearish divergences are common to waves A and C, just as they are waves 3 and 5.
Notice the bearish divergence between waves 3 and 5 in the daily price chart of Halliburton Company (HAL) -- Prices reach a new high, yet the MACD indicator moves in the opposite direction:
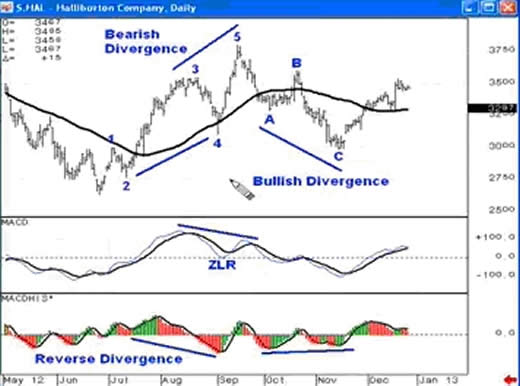
Jeffrey notes that if you label an advance as a 5th wave move, and yet you do not see momentum divergence, that tends to argue for an extended 5th wave.
Next, at waves A and C, you can see an example of bullish divergence. Wave A bottomed at $32.90 in HAL and wave C ended much lower at $29.83. The histogram readings that correspond to waves A and C are -36.26 and -26.60, respectively.
Here's another example of divergence between waves A and C in Akamai Technologies (AKAM).
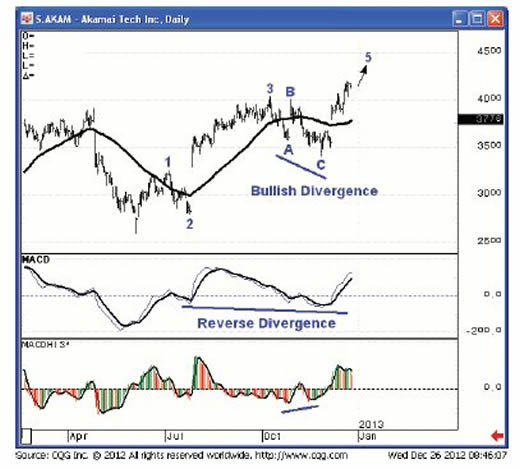
Notice that wave C is lower in price than wave A. However, if you look at the MACD histogram, you'll see that it registered a higher reading in wave C than it did in wave A, thus giving us a bullish divergence.
Understanding that Elliott waves demonstrate unique momentum relationships as well as price structure allows you to label waves more accurately and with greater confidence.
|
Learn to Use Technical Indicators to Improve Your Trading and Analysis This is merely one chart example of how you can use technical indicators to strengthen your analysis. You can also learn about Moving Averages, one of Jeffrey Kennedy's favorite indicators, in a Free 10-page eBook from Elliott Wave International. Moving averages are one of the most widely-used methods of technical analysis because they are simple to use, and they work. Now you can learn how to apply them to your trading and investing in this free 10-page eBook. Learn step-by-step how moving averages can help you find high-confidence trading opportunities. Improve your trading and investing with Moving Averages! Download Your Free eBook Now >> |
This article was syndicated by Elliott Wave International and was originally published under the headline Learn to Label Elliott Waves More Accurately. EWI is the world's largest market forecasting firm. Its staff of full-time analysts led by Chartered Market Technician Robert Prechter provides 24-hour-a-day market analysis to institutional and private investors around the world.
About the Publisher, Elliott Wave International
Founded in 1979 by Robert R. Prechter Jr., Elliott Wave International (EWI) is the world's largest market forecasting firm. Its staff of full-time analysts provides 24-hour-a-day market analysis to institutional and private investors around the world.
© 2005-2022 http://www.MarketOracle.co.uk - The Market Oracle is a FREE Daily Financial Markets Analysis & Forecasting online publication.