Stock Market Rally Peak Almost, But Not There Yet
Stock-Markets / Stock Markets 2013 Jan 06, 2013 - 01:04 PM GMT Following on from last week's report, we are within striking distance of the Sept 2012 highs on the SPX and ES.
There were many other markets that made impressive moves, the Russell 2000 making new all time highs as did the little followed value line index.
To bullish traders and Elliotticians it should have come as no surprise, if you studied price long enough and remain non-biased and accept what you see, then the upside move was virtually guaranteed, but the bears once again found out the hard way of fighting price and ignoring what price suggested.
Let me make one point here, I am fully aware of the economic situations around the world, I am not naive enough to think these things don't matter, but when it come to actual trading of the markets, the ONLY THING THAT PAYS IS PRICE.
You can argue the bad funnymentals to you are blue in the face, but that does not change a thing if price wants to go higher.
If you fight the market you lose money. It's as simple as that, as this week many bears found out.
It's not about being a bull or bear, it's about being on the right side of the market, looking at what price suggests and sticking with the trend.
If price reverses and shows me a clear indication that it's a bearish market, I am ready to switch and follow the market lower, but whilst I have unfinished targets on the upside and patterns that don't look complete I can only follow what my long terms ideas suggest, or until such a time the market negates the ideas.
I see many still in disbelief at the way this market comes charging higher and many bears now "throwing in the towel".
ES
But whilst we are close to my long standing targets we are not there yet, and some other markets like the SPX, DOW and COMPQ are still far behind those Sept 2012 highs, so I am still going to continue to look higher.
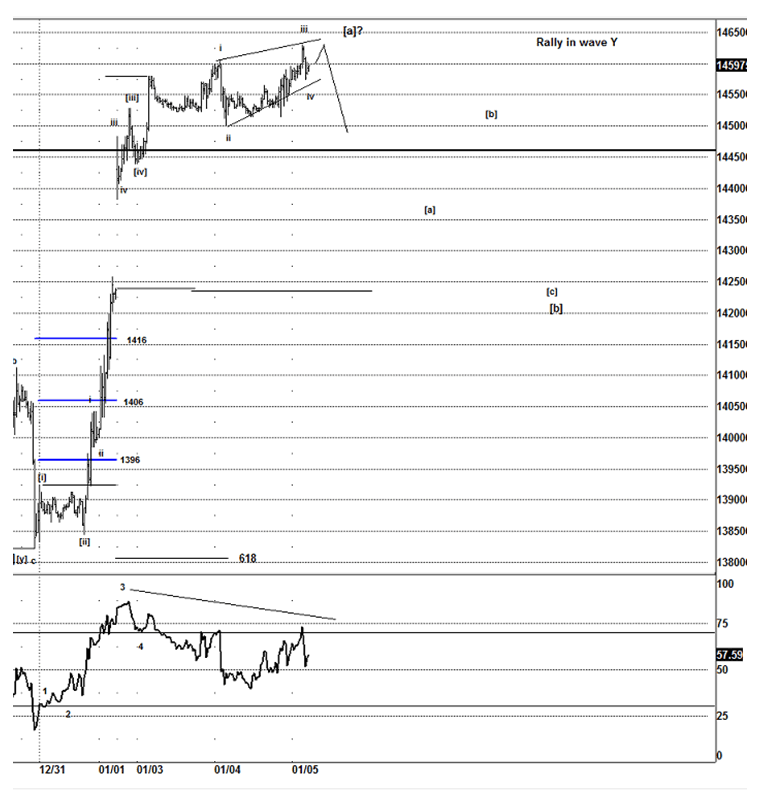
However short term from the 1383ES lows, it appears we could be ready to pullback in a correction to correct some of the advance.
It's come a long way in a short period a time and it would not be unreasonable to expect a pullback and give the chance for the market to take a breather, we appear to be in some sort of wedge, so I suspect an ending diagonal, and once its finished I am then looking for a move lower in 3 waves, potentially targeting towards the 1430ES area, but I will have a better idea if any decline starts earlier next week.
NDX
The NDX appears to have started already, as we saw some weakness between the NQ and SPX, and this was one of the better ideas I noticed late last week and posted the setup for members to look to take advantage on the short side as it looked a much better wave count than the other markets.
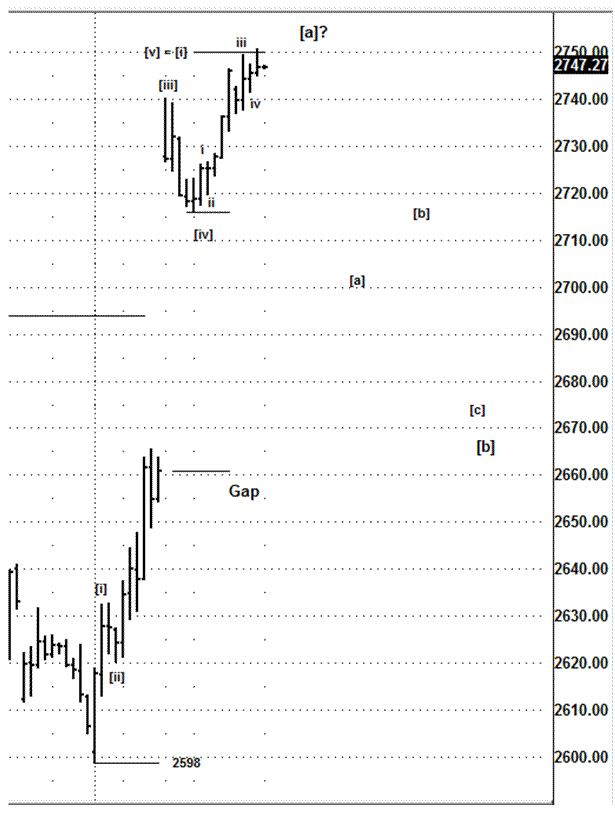
As the NDX was pulling back the SPX still found some strength to push to a new high on Friday, but with the non-confirmation I suspect the NDX is suggesting that we are going to pullback and correct some of last week's advance.
As long as any decline is a corrective move then it will offer the bulls a chance to get long or add to long positions for a move higher.
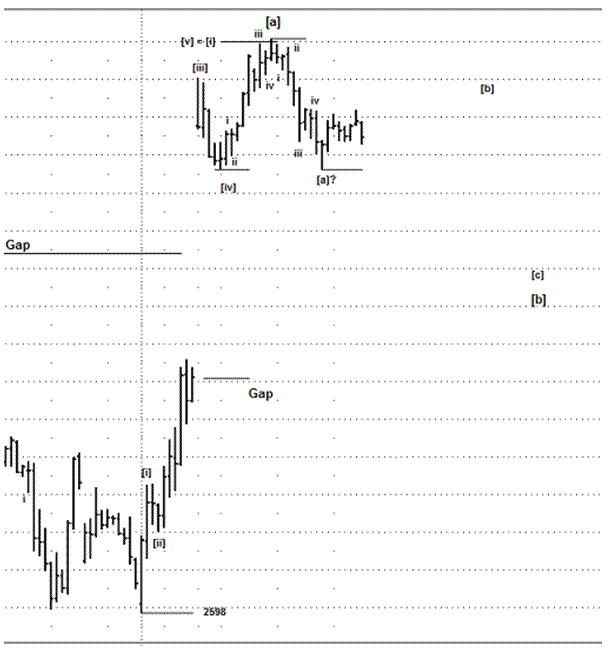
Currently the preferred idea is still to buy pullbacks as long as they remain within the context of the daily and weekly ideas we are working with, so as the market remains firmly bullish, traders should continue to respect the larger trend until we see evidence to suggest caution on the long side, although I am expecting a pullback shortly as the NDX with a clear 5 wave rally looks to be the leader on a correction.
SPX
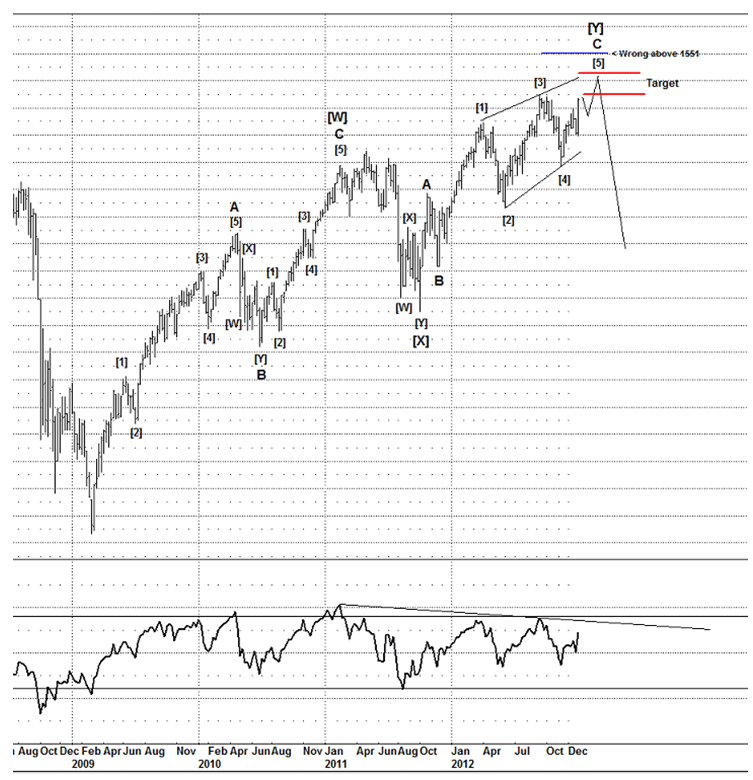
The SPX main count suggests a potential ending diagonal/bearish wedge and it's been my main idea for about 3 months now, since I was 99.9% sure the decline from the Sept-Nov 2012 was a 3 wave decline it fit perfectly for a 4th wave of an ending diagonal, so the idea shown needs a move above 1474SPX at minimum, but I am looking for move into the 1480-1500SPX area, although once a new high is seen I am on high alert for any potential reversal.
Bull Vs Bear case
Now some Elliotticians have a wave count that suggest the market is about to launch into a parabolic blow off in some sort of 3rd wave move to the upside, whilst I can't actually negate that idea, I will try to show some evidence as to why I think the market is working the preferred idea as shown above.
If you look around some major stocks, there is some evidence to suggest that they are making some important top and based upon my interpretation of their respective Elliott Wave counts, I have concluded that I think they will make important tops along with the US markets.
XOM (Exxon)
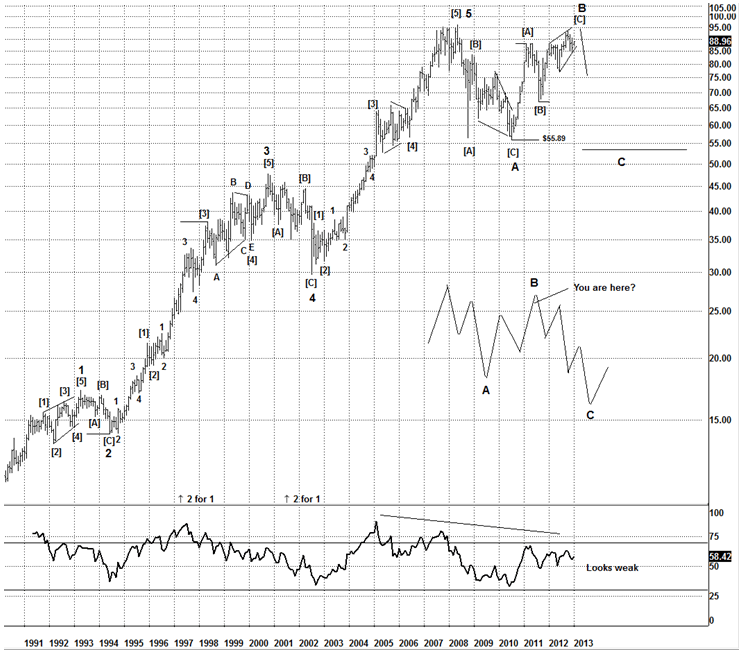
With this stock we can see that it has a 5 wave advance into 2008 highs, and a clear 3 wave decline, which I have labeled wave A, but the advance from the $55.89 lows appears to be a 3 wave move as well, with a small new high it also looks to be ending a smaller wedge shape for wave [C] of a larger B.
With a 3 wave decline and a 3 wave advance, the most obvious pattern to an Elliottician is a 3-3-5 flat, so we are missing the 5 wave leg for wave C, which suggests a move back to move back under $55.89.
The most important part of what is going on with this stock at the moment is the potential for a small wedge shape what Elliotticians call an ending diagonal.
SRCL (Stericycle)
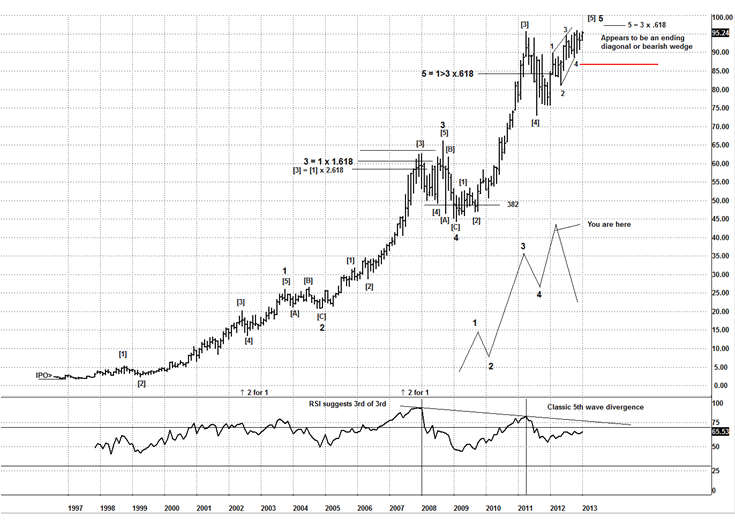
From its IPO it appears this is finishing a larger 5 wave advance and if you look closer it looks like a wedge and the same idea and pattern as XOM and the SPX etc, that of an ending diagonal, although this looks almost completed with a minor new high needed, I am watching closely to suggest to members that they can looking to sell short this stock, or buy puts, as once it reverses I am expecting a strong reversal lower, but this is a monthly chart, so we need to get our timing correct 1st, the potential for a strong reversal is HUGE.
CRM (salesforce.com)
An interesting stock that I am watching is CRM, it was bought to my attention by a member and I was asked to take a look to see if I could identity a pattern for a trade setup.
I was pleasantly surprised as from its IPO it looks like a larger 5 wave pattern, the most interesting thing to note is the large triangle for a 4th wave.
If you know anything about Elliott Wave you will note that triangles most commonly occur in the 4th wave positions, so with the triangle thrust this stock I suspect is in its final stages of the move that started from its IPO and a major top setting up.
All 3 of those stocks are suggesting important inflection points, and that coupled with the look of the US markets suggest in the authors opinion that US stocks and the US markets are nearing an important and potential major inflection point, hence why I suspect that the markets are nearing a major topping area and not setting up for a strong new bull cycle.
That's just 3 stocks I am watching there are about 10 others I am also watching with equally good ideas and members that are interested in those stocks are sure to find themselves with plenty of opportunities in 2013.
If you are interested in following these ideas and a whole lot more, then take a test drive and sign up for the 4 week free trial, with price starting to enter some key and critical price zones I am confident that 2013 will be a great year for volatility and some great ideas and setups to be traded.
Until next time
Have a profitable week ahead.
Click here to become a member
You can also follow us on twitter
What do we offer?
Short and long term analysis on US and European markets, various major FX pairs, commodities from Gold and silver to markets like natural gas.
Daily analysis on where I think the market is going with key support and resistance areas, we move and adjust as the market adjusts.
A chat room where members can discuss ideas with me or other members.
Members get to know who is moving the markets in the S&P pits*
*I have permission to post comments from the audio I hear from the S&P pits.
If you looking for quality analysis from someone that actually looks at multiple charts and works hard at providing members information to stay on the right side of the trends and making $$$, why not give the site a trial.
If any of the readers want to see this article in a PDF format.
Please send an e-mail to Enquires@wavepatterntraders.com
Please put in the header PDF, or make it known that you want to be added to the mailing list for any future articles.
Or if you have any questions about becoming a member, please use the email address above.
If you like what you see, or want to see more of my work, then please sign up for the 4 week trial.
This article is just a small portion of the markets I follow.
I cover many markets, from FX to US equities, right the way through to commodities.
If I have the data I am more than willing to offer requests to members.
Currently new members can sign up for a 4 week free trial to test drive the site, and see if my work can help in your trading and if it meets your requirements.
If you don't like what you see, then drop me an email within the 1st 4 weeks from when you join, and ask for a no questions refund.
You simply have nothing to lose.
By Jason Soni AKA Nouf
© 2012 Copyright Jason Soni AKA Nouf - All Rights Reserved
Disclaimer: The above is a matter of opinion provided for general information purposes only and is not intended as investment advice. Information and analysis above are derived from sources and utilising methods believed to be reliable, but we cannot accept responsibility for any losses you may incur as a result of this analysis. Individuals should consult with their personal financial advisors.
WavePatternTraders Archive |
© 2005-2022 http://www.MarketOracle.co.uk - The Market Oracle is a FREE Daily Financial Markets Analysis & Forecasting online publication.


